Gallery
Basemap
Basemap is used for projection setting of these graphs
-
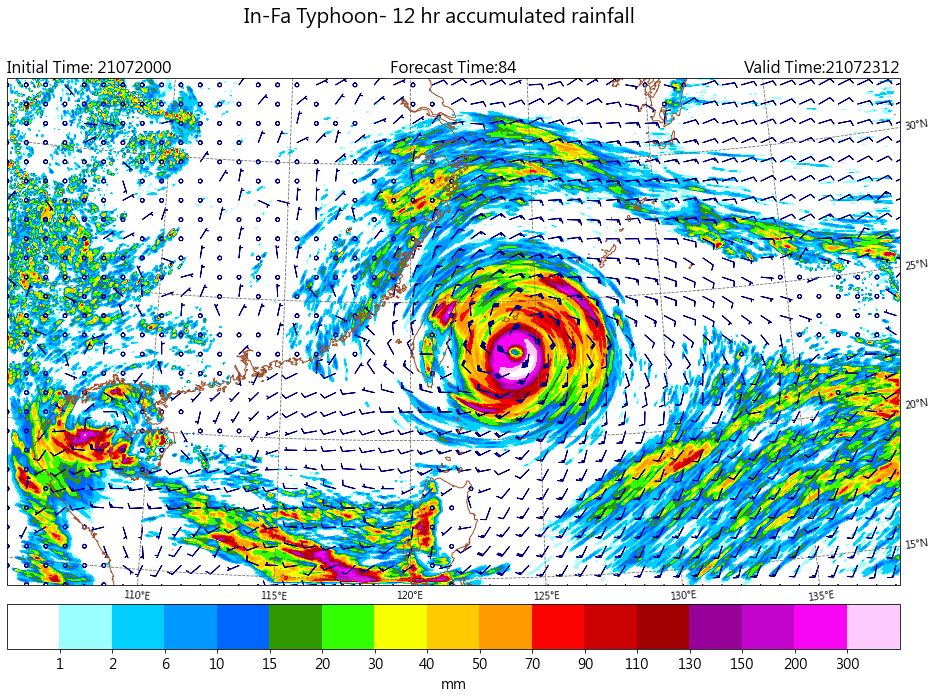
Rainfall
|
-
Surface Temperature and Sea Level Pressure
|
-
Two colobar in a Figure
|
-
Relative humidity and streamline
|
-
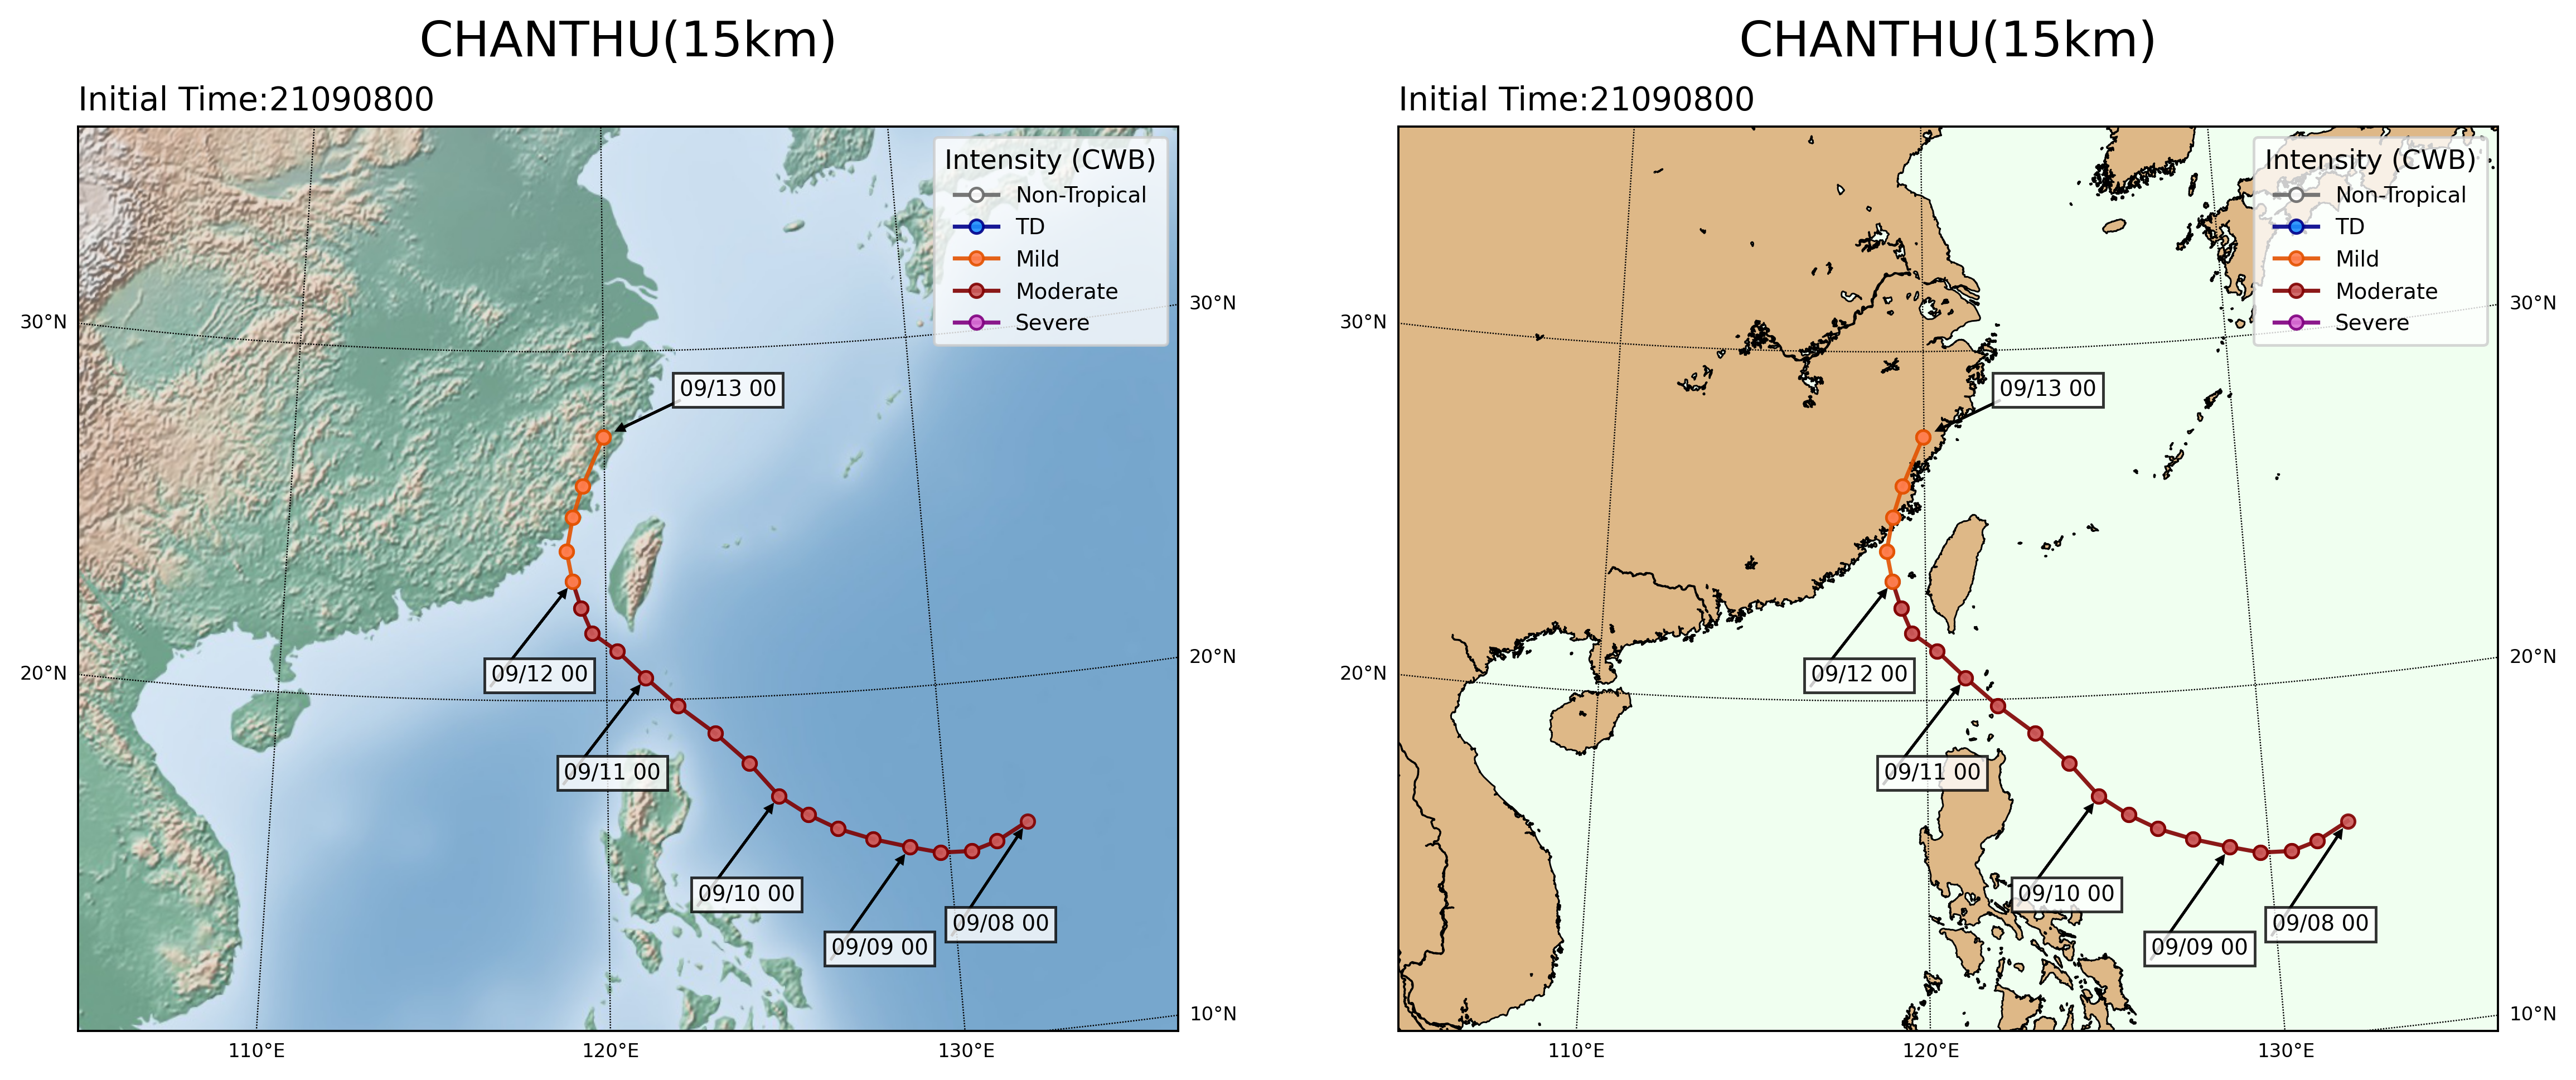
Typhoon Track
|
-
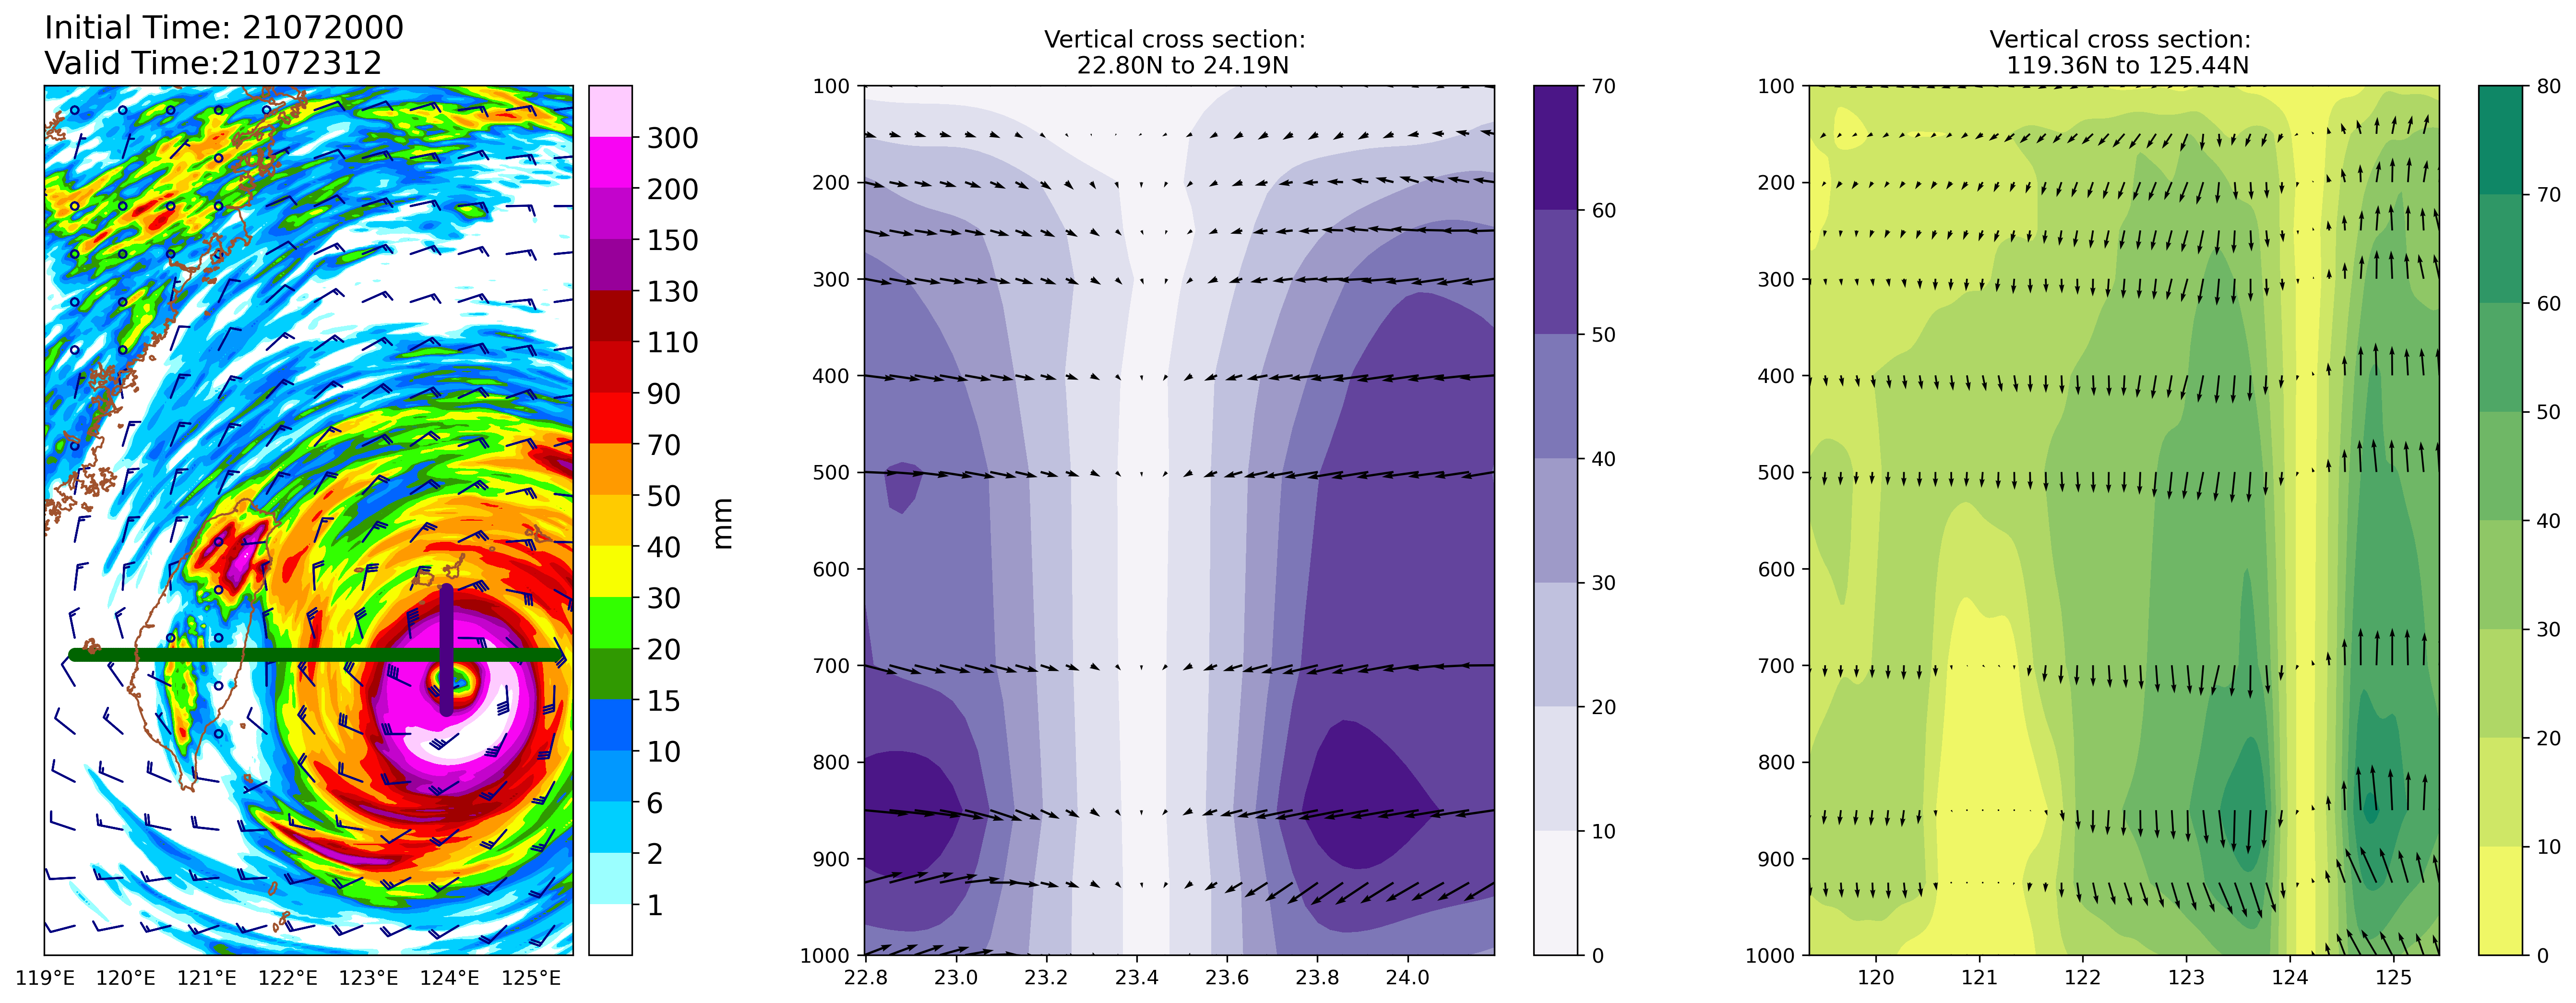
Vertival cross section for grib2 data format
|
Cartopy
Cartopy is used for the projection setting of these graphs.
-
Rainfall
|
-
Surface Temperature and Sea Level Pressure
|
-
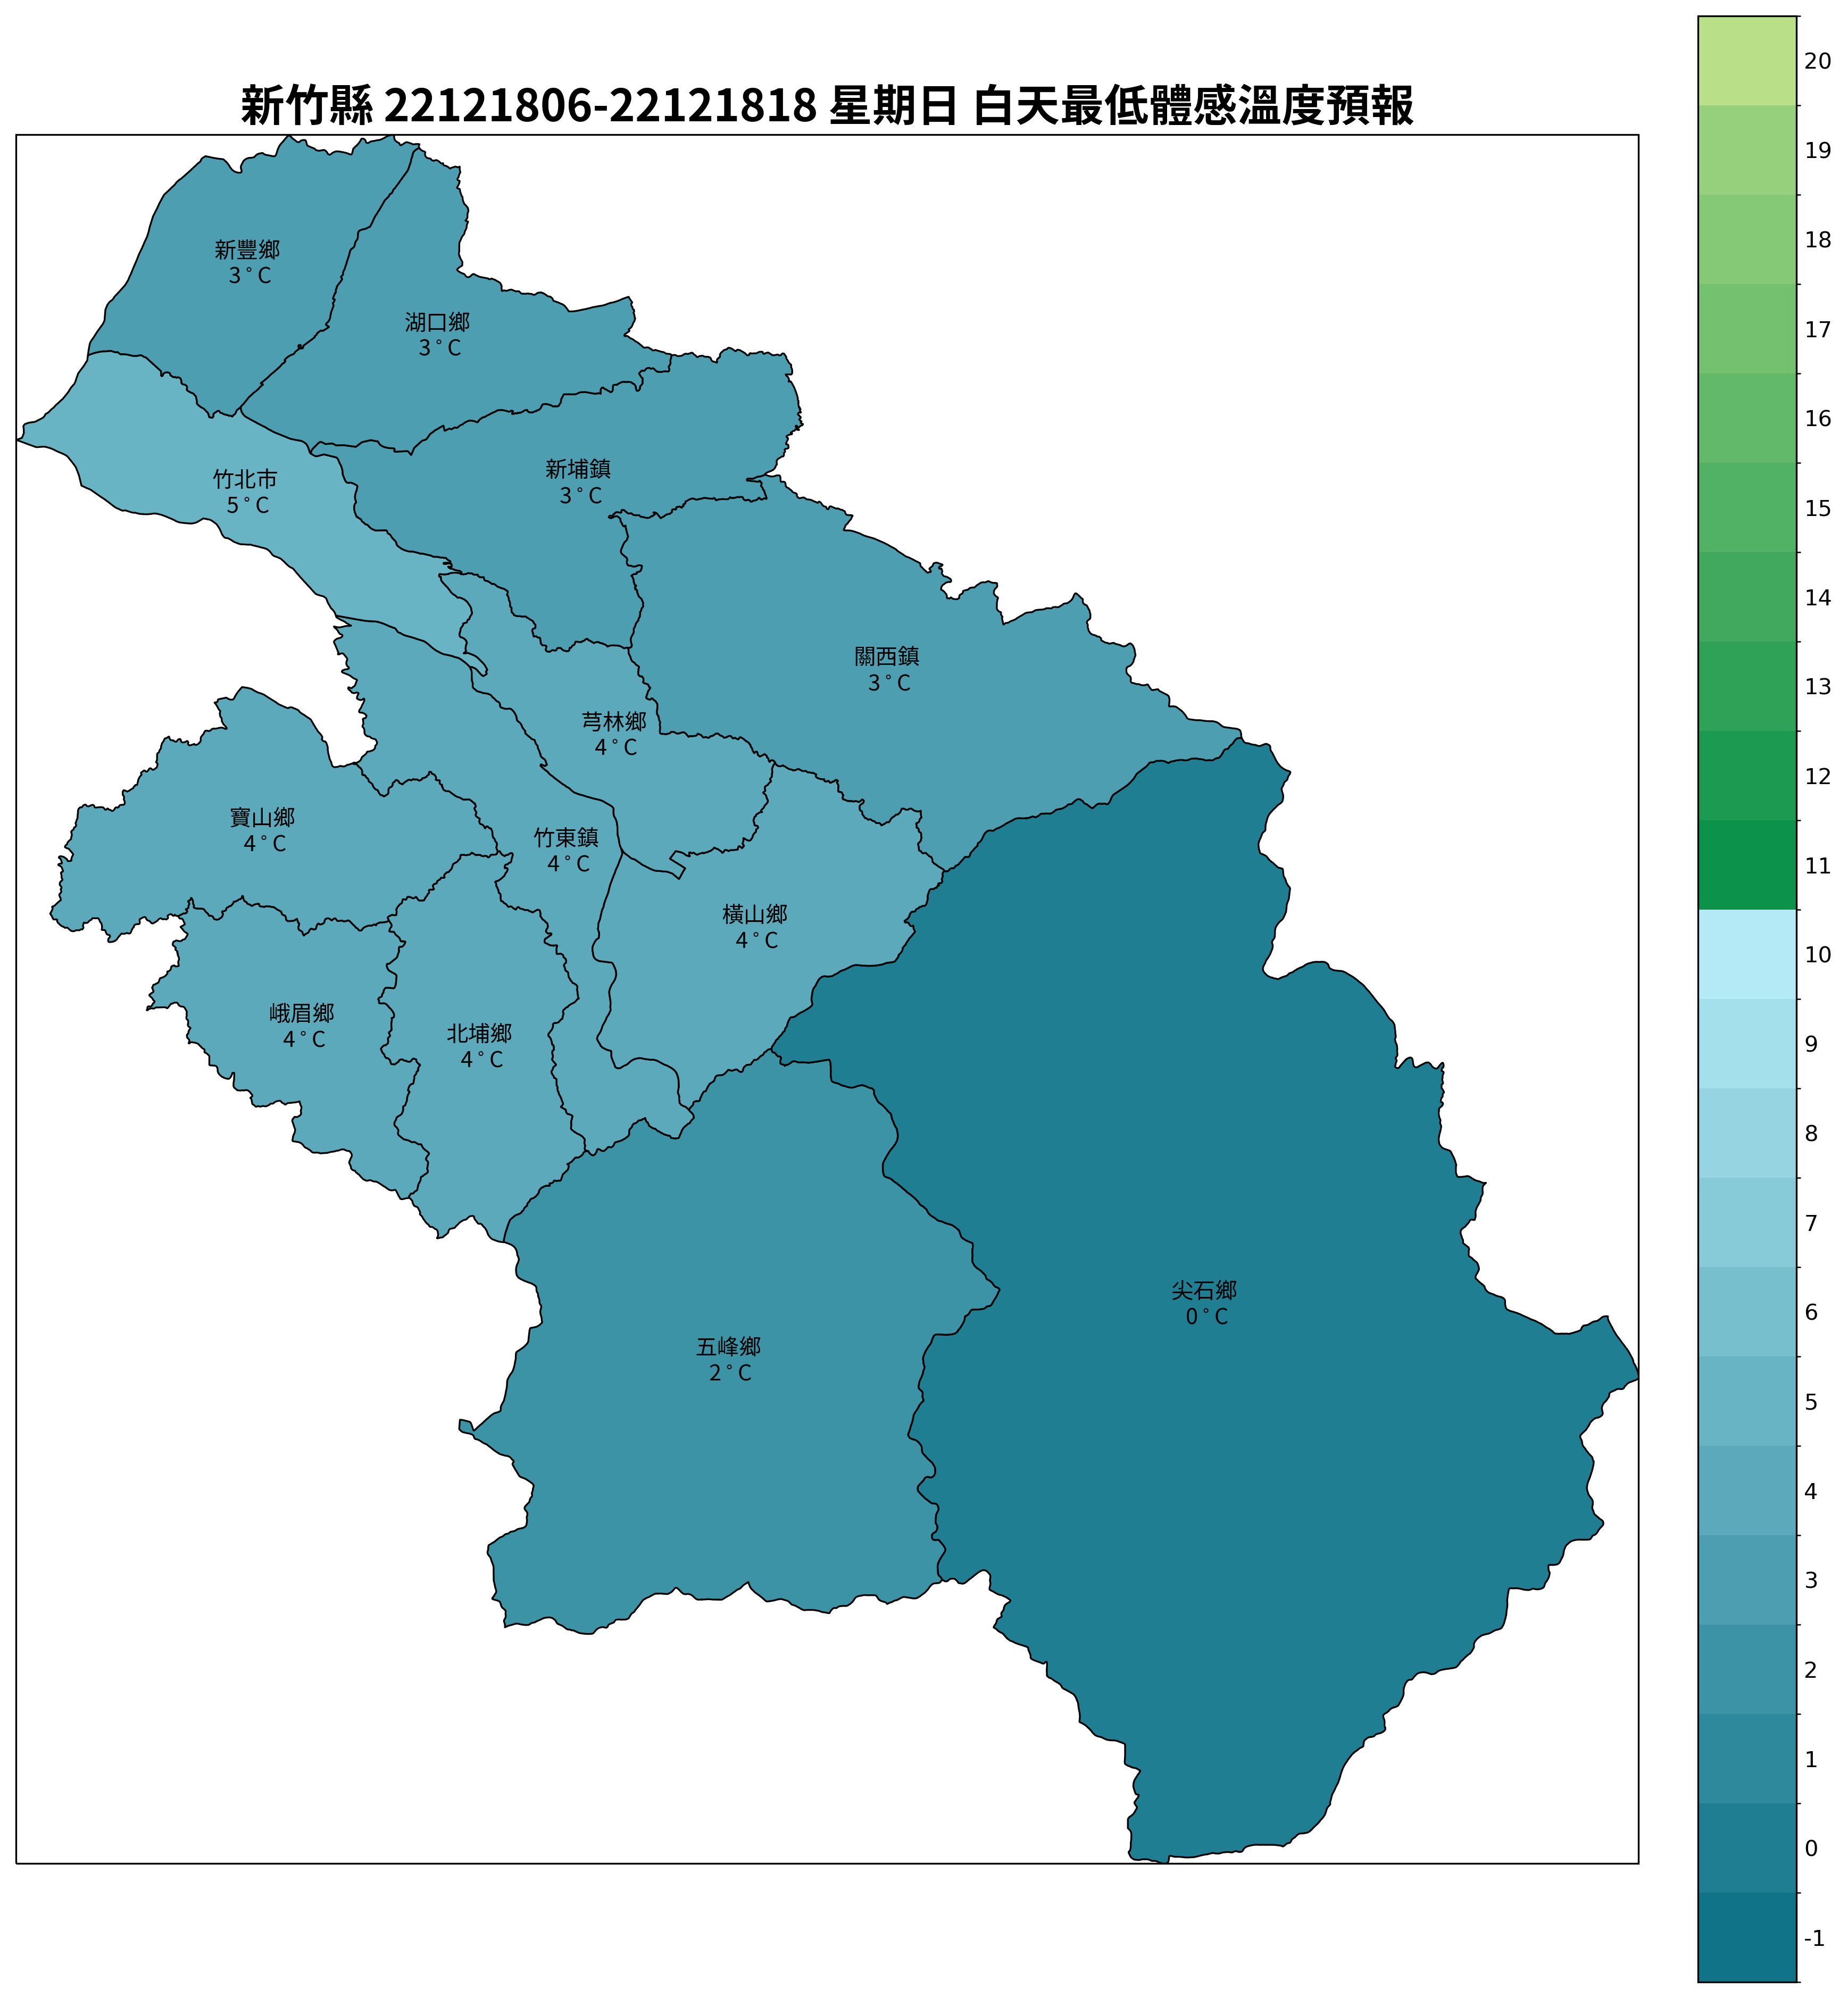
最低體感溫度
|
-
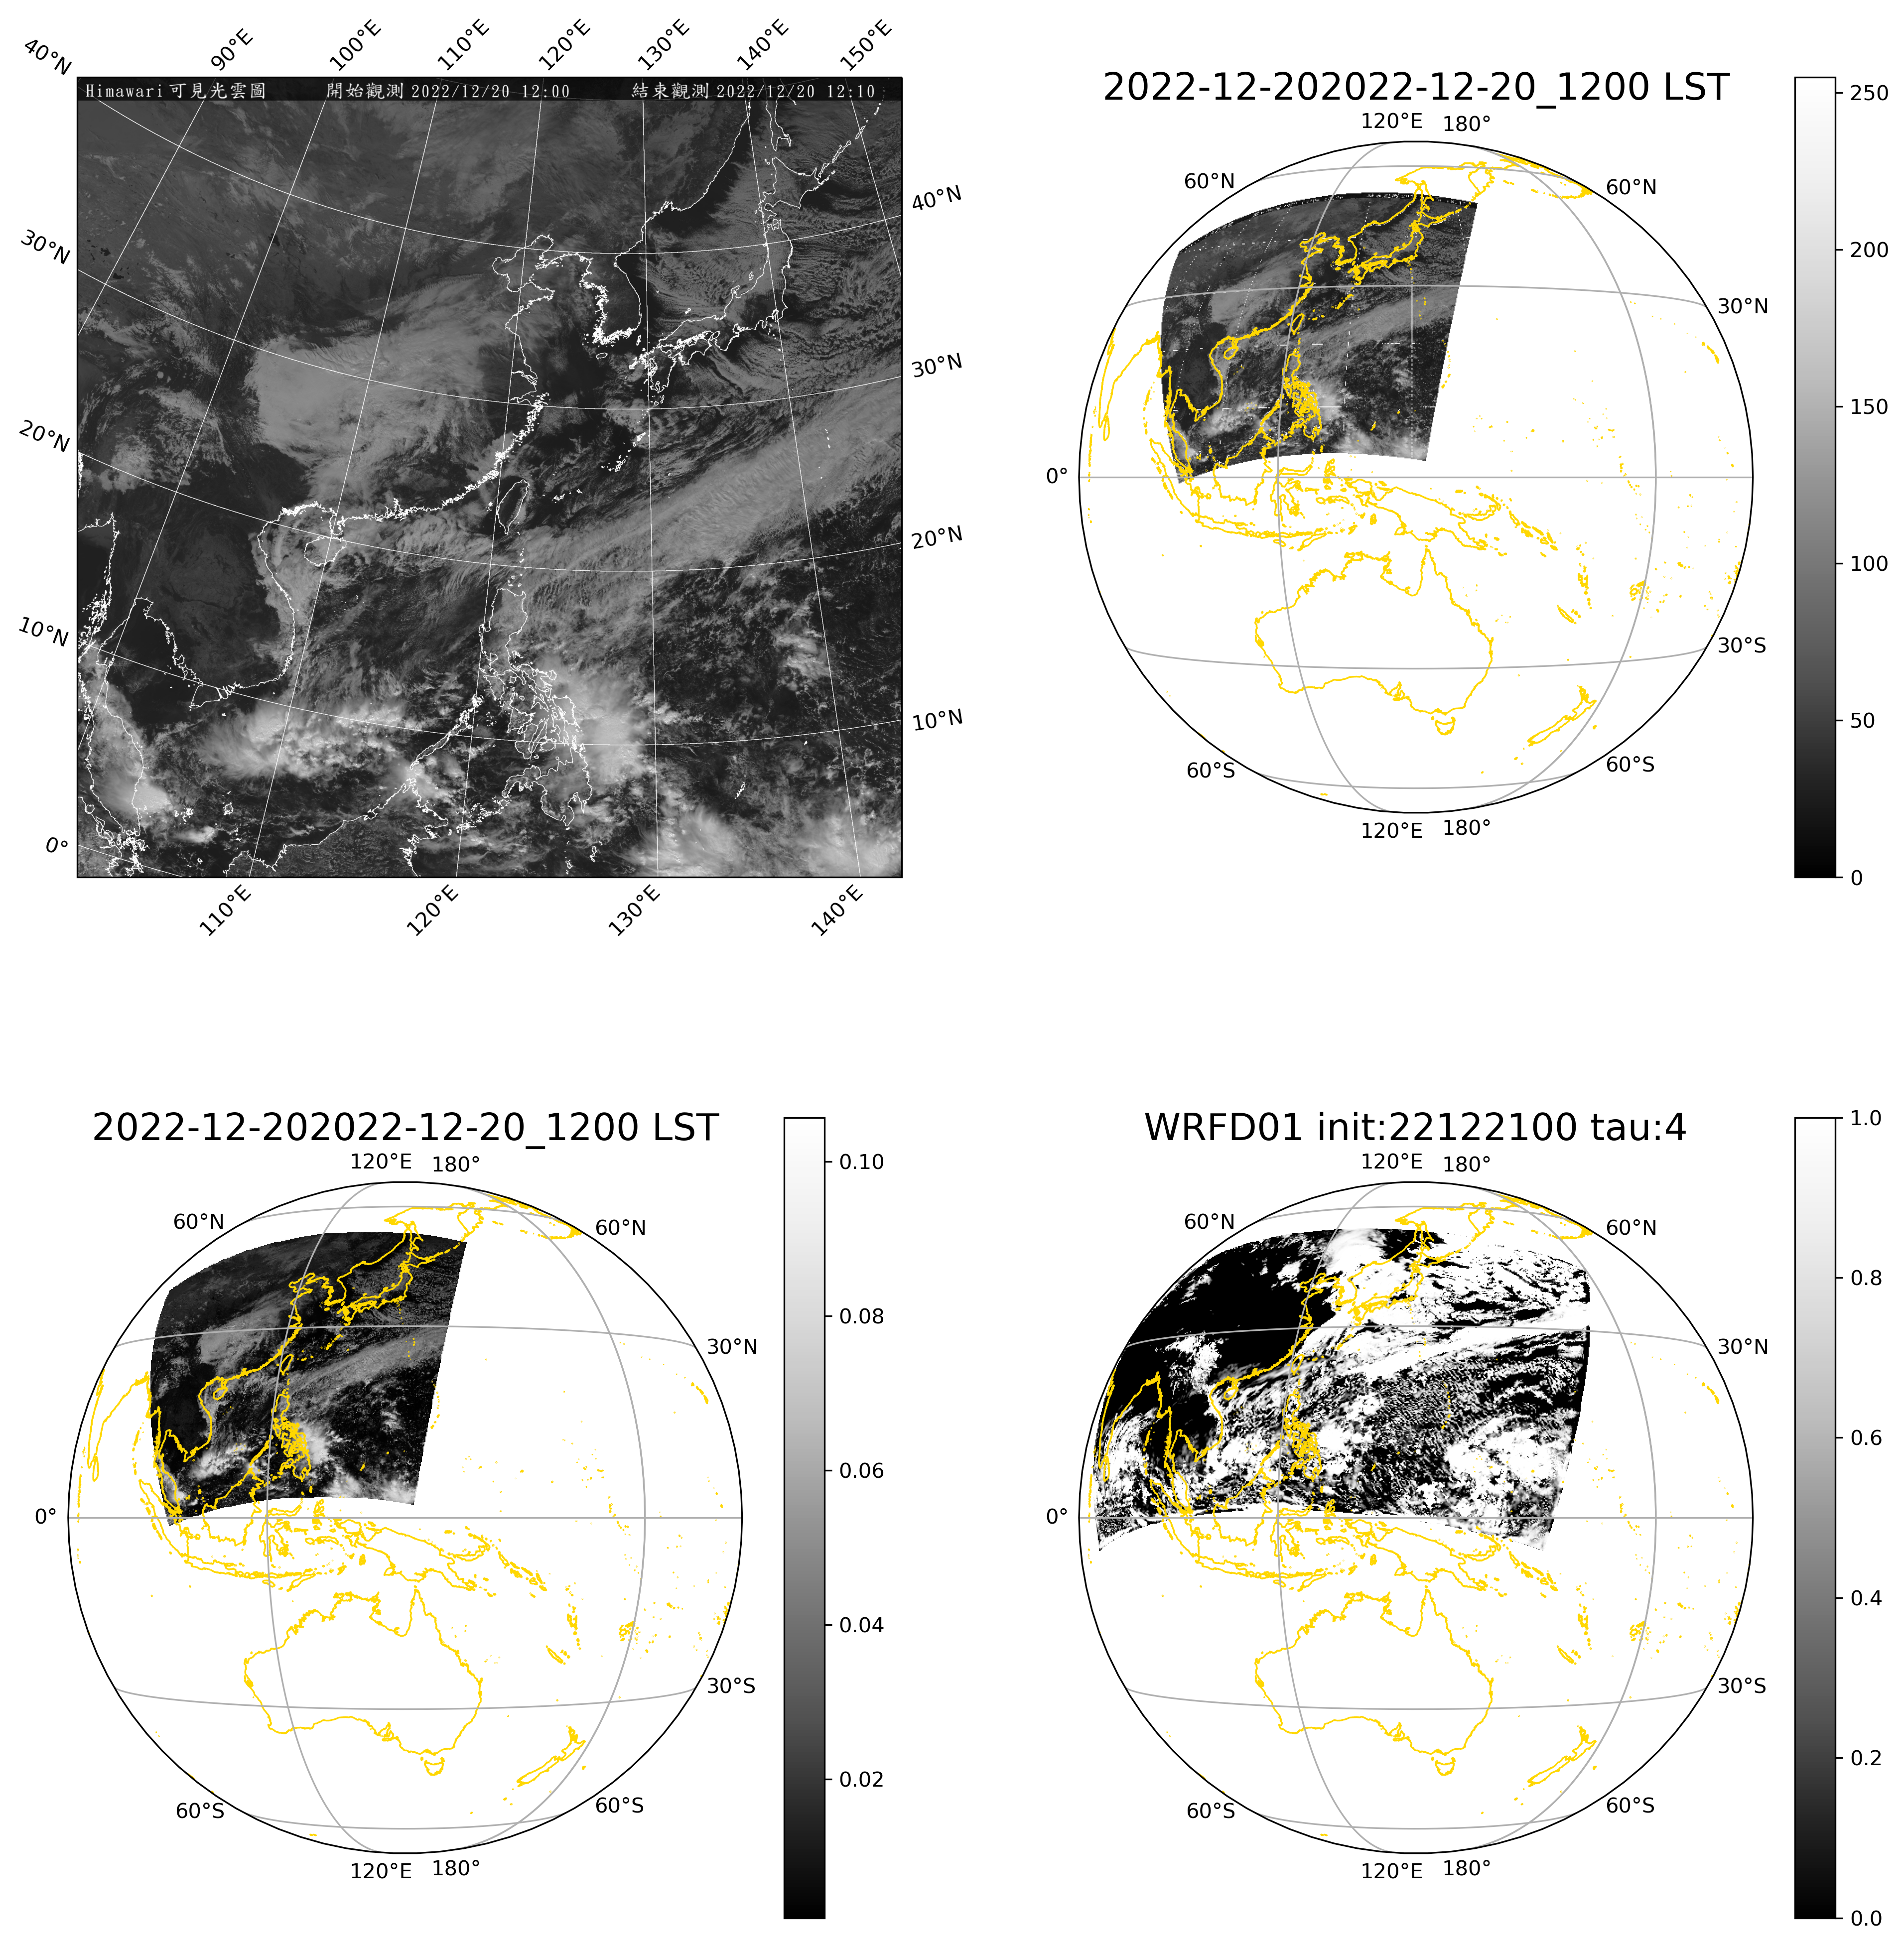
衛星圖(觀測,模式預報)
|
|
|
Projinfo
This section provieds some graphs for how to ues projinfo
important: projinfo is based on Basemap
-
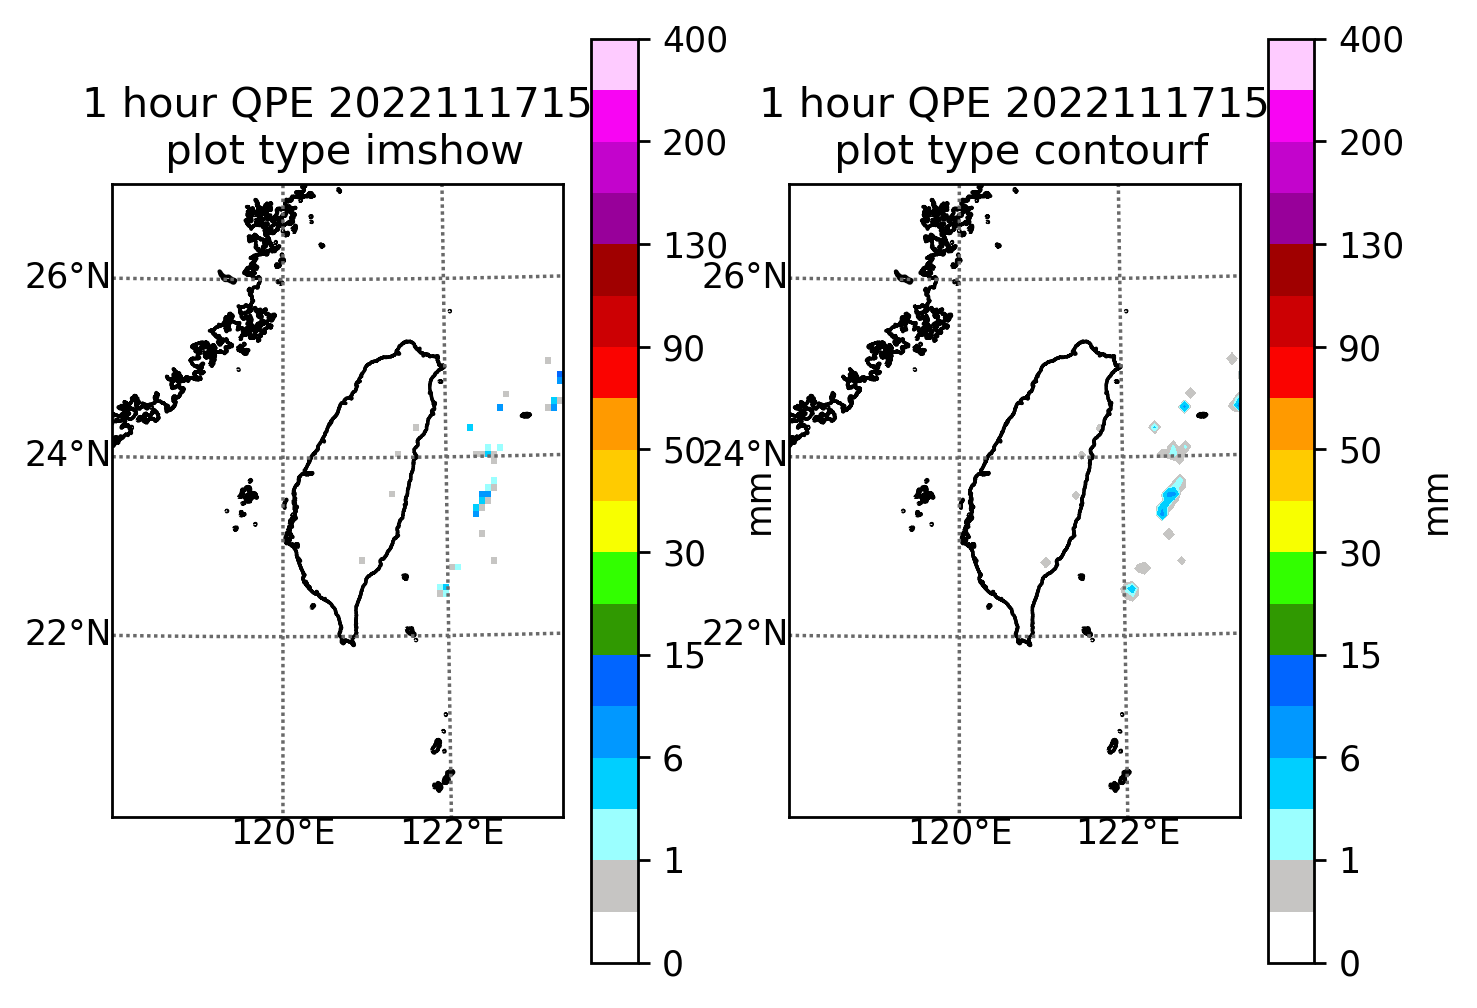
1 hour QPE
|
-
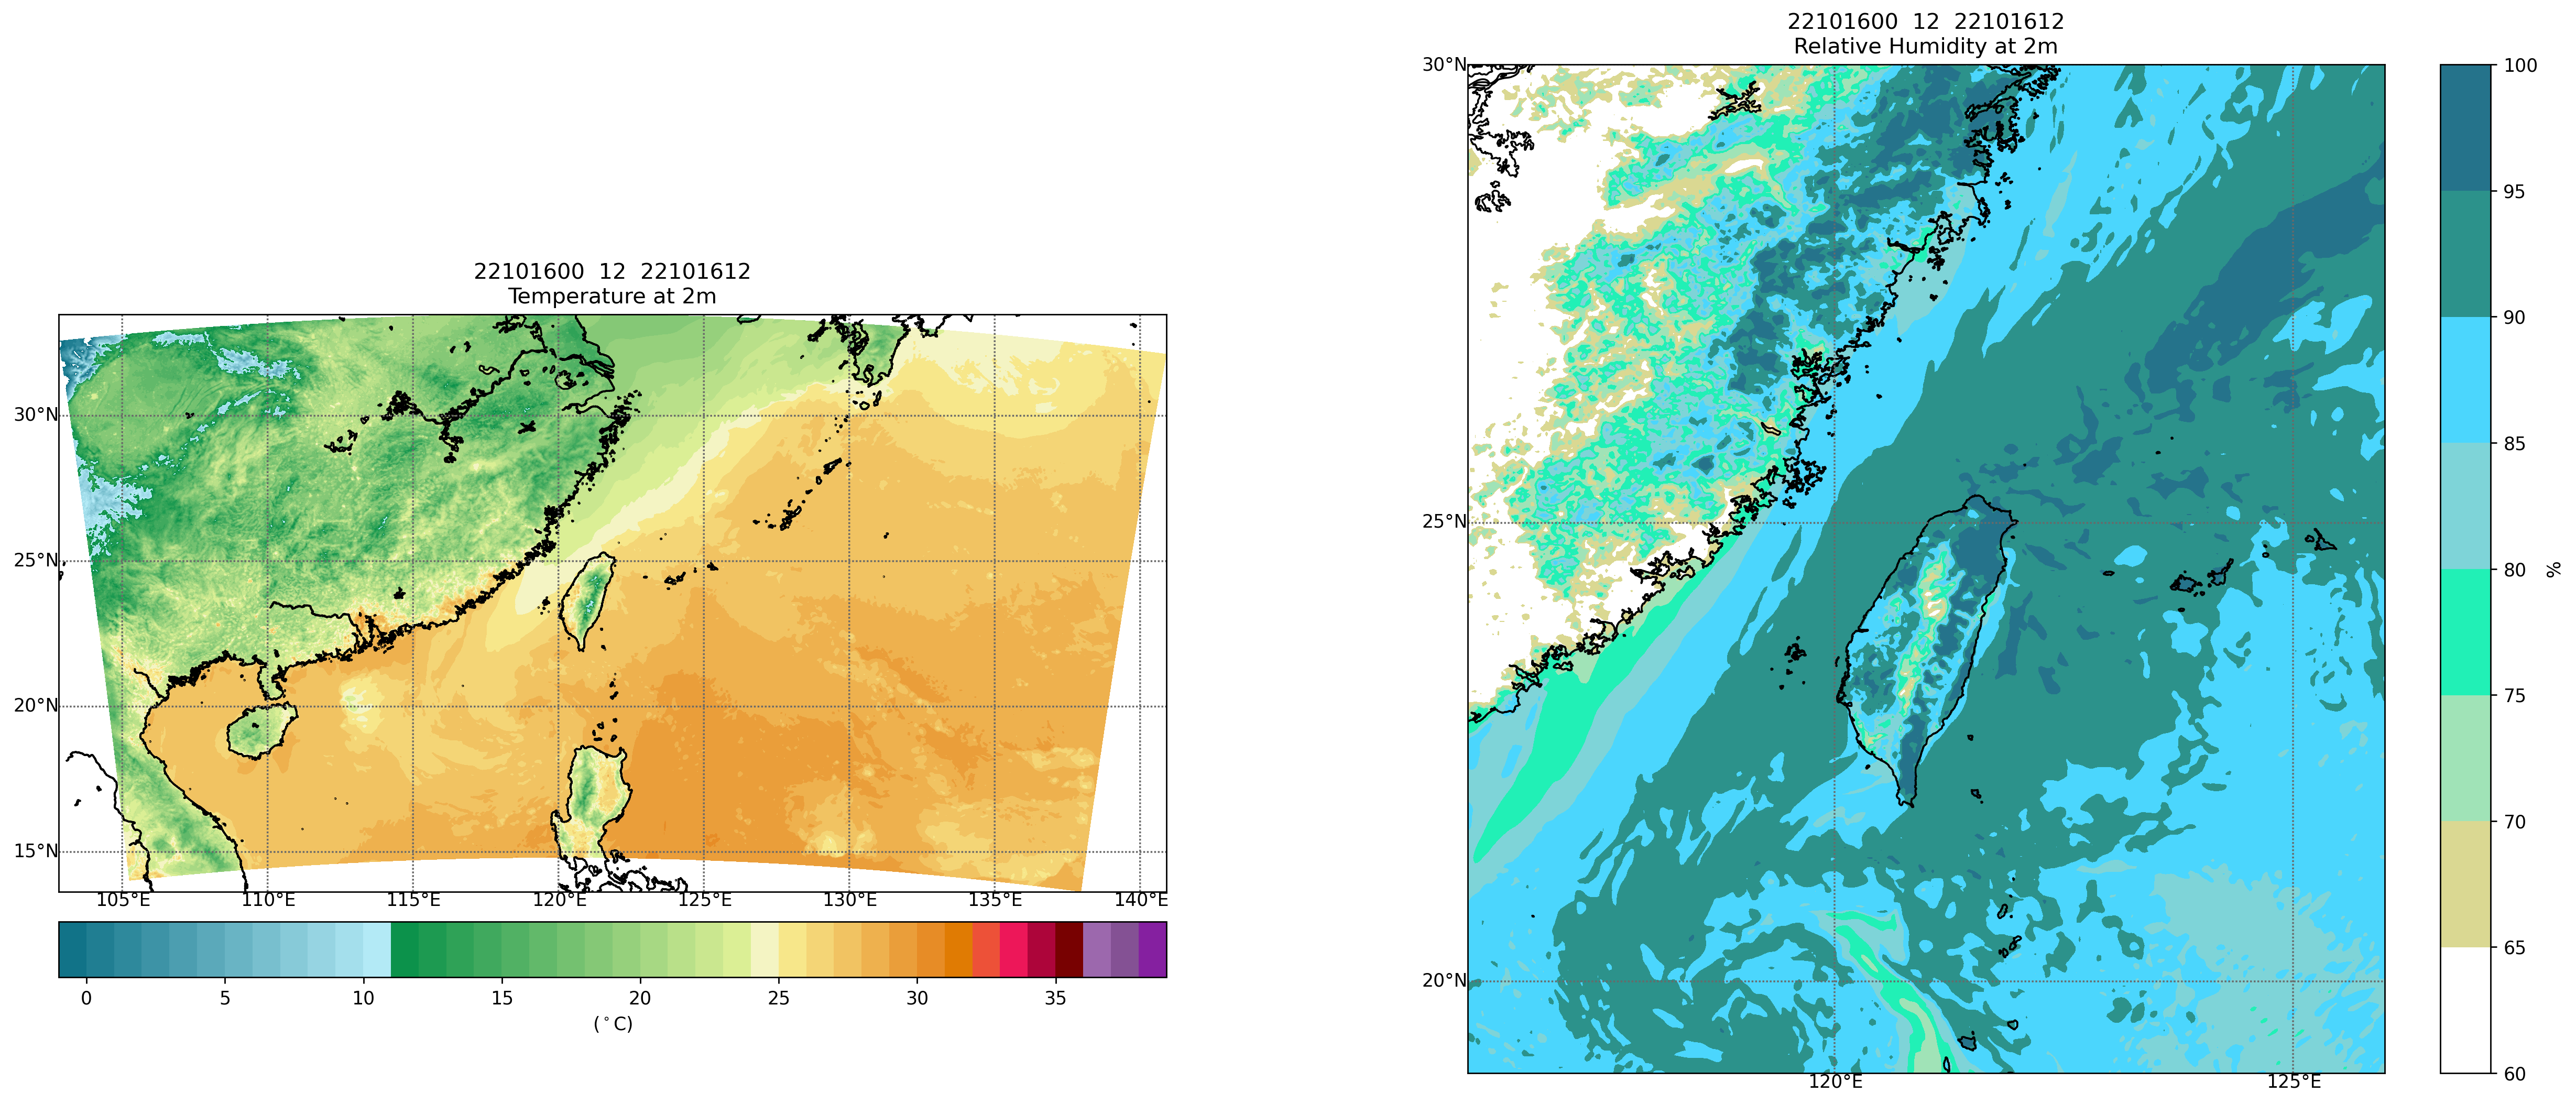
Surface Temperature and surface relative humidity
|
Data Analysis
This section provieds some graphs for data analysis.
-
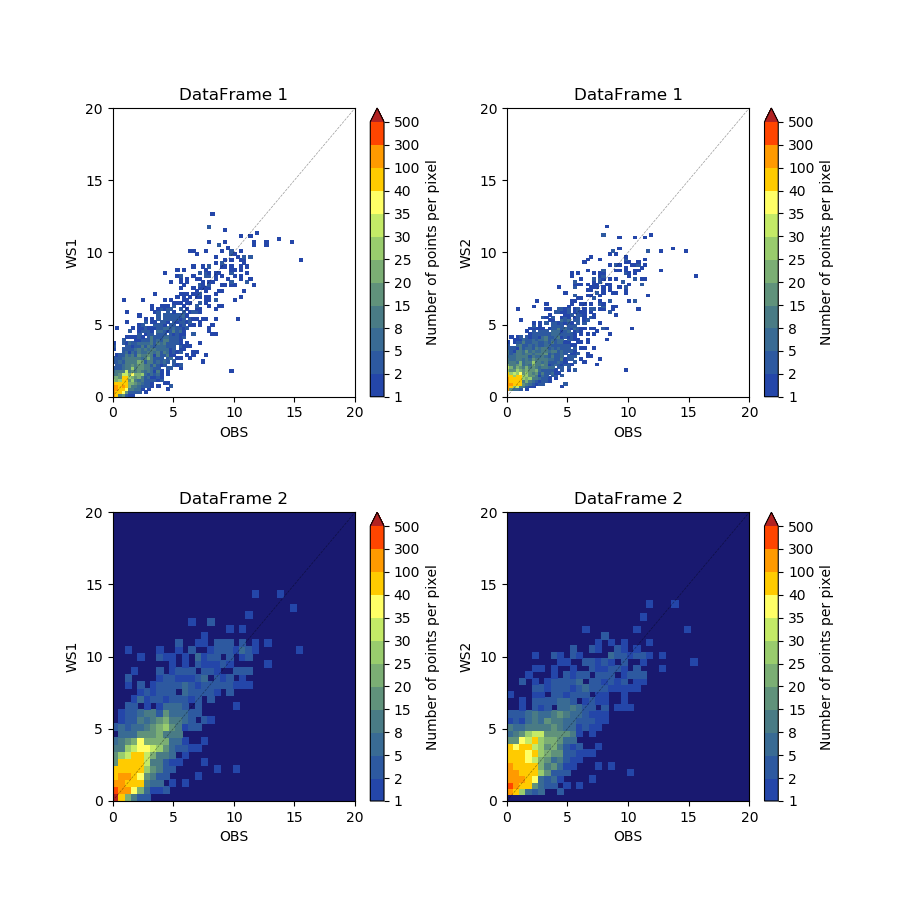
Frequency scatter plot by hist2d
|
-
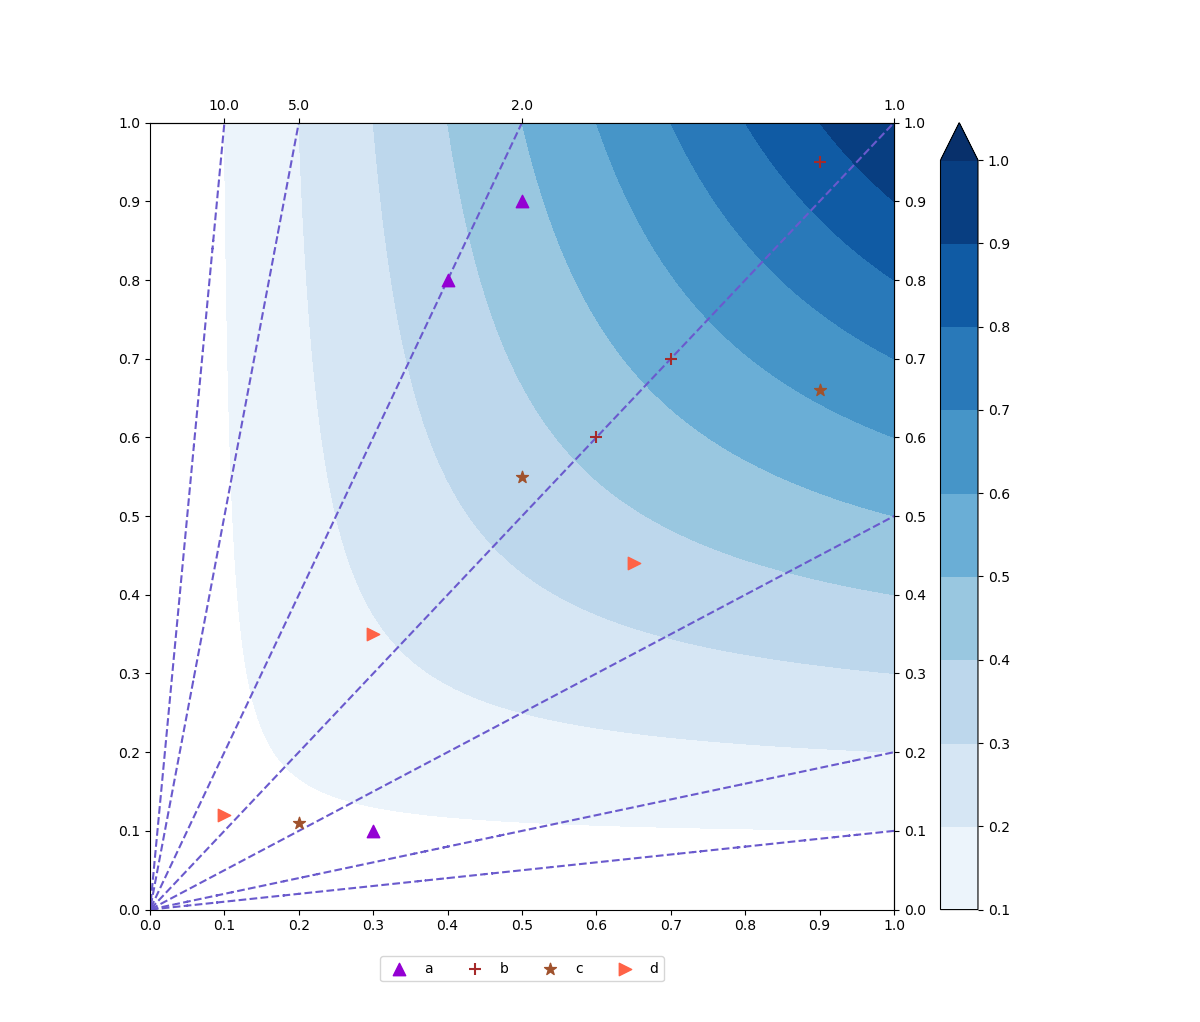
Performance digram
|
-
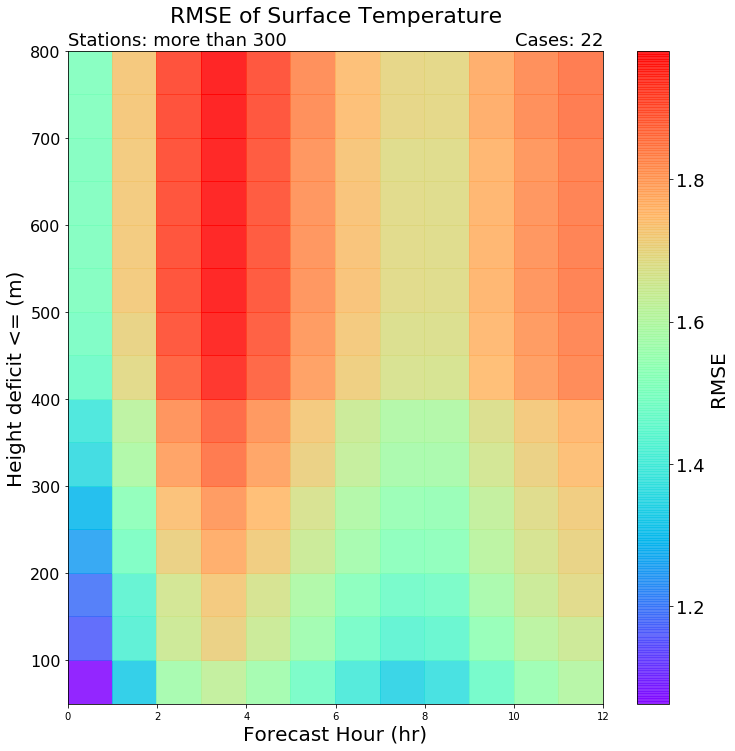
Surface temperature dia with different elevation deficit
|