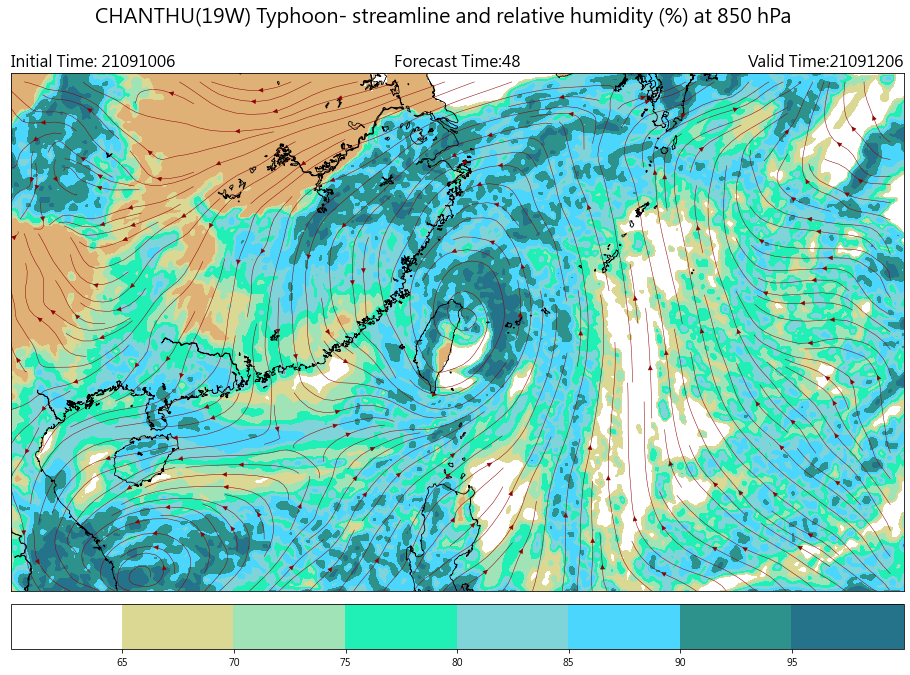
Relative Humidity and Streamline
Plotting relative hunidity and streamline.
CWB regional numerical weather model data are used in this example.
Data format: Grib2
Data source: CWB opendata website
 import numpy as np
 import pygrib as pb
 import matplotlib.pyplot as plt
 from mpl_toolkits.basemap import Basemap
 import cwbplot.cwb_colorbar as cwbcbar

 tau_48 = pb.open("M-A0064-21091006-048.grb2")
 basicvar_48 = tau_48.select()[:]
 lon_0, lat_0 = basicvar_48[0]["LoVInDegrees"], basicvar_84[0]["LaDInDegrees"]
 lat_1, lat_2 = basicvar_48[0]["Latin1InDegrees"], basicvar_84[0]["Latin2InDegrees"]
 lats, lons = basicvar_48[0].latlons()
 proj = Basemap(projection="lcc",resolution='h',lat_0 = lat_0 ,lon_0 = lon_0 ,lat_1 = lat_1, \
         lat_2 = lat_2, llcrnrlat = lats[0,0], llcrnrlon = lons[0,0], urcrnrlat = lats[-1,-1], \
         urcrnrlon = lons[-1,-1])

 analDate = basicvar_48[0].analDate.strftime("%y%m%d%H")
 fcst = str(basicvar_48[0].forecastTime)
 valDate = basicvar_48[0].validDate.strftime("%y%m%d%H")

whichlv = 850
 rh850 = tau_48.select(parameterName="Relative humidity", level=whichlv)[0]["values"]
 rh850[rh850<65] = np.nan
 u850 = tau_48.select(parameterName="u-component of wind", level=whichlv)[0]["values"]
 v850 = tau_48.select(parameterName="v-component of wind", level=whichlv)[0]["values"]

 fig = plt.figure(figsize=(16,12))
 proj.drawcoastlines(linewidth=0.8, color='k')
 proj.drawlsmask(land_color='#DFB177',ocean_color='None')

 rhcbar = cwbcbar.rh(style = "rhcc")
 ctf = proj.contourf(lons, lats, rh850, **rhcbar, latlon = True)
 cbar = plt.colorbar(ctf,orientation='horizontal',pad=0.02,ticks=rhcbar["levels"][1:-1])

 xx, yy = proj.makegrid(v850.shape[1], v850.shape[0], returnxy=True)[2:4]
 dictstream = {"arrowstyle":"-|>","linewidth":0.5,"color":"darkred"}
 proj.streamplot(xx[::20, ::20], yy[::20, ::20], u850[::20, ::20], v850[::20, ::20], density = 2,**dictstream)

 plt.title("Initial Time: {}".format(analDate), loc="left",fontsize=16)
 plt.title("Forecast Time:{}".format(fcst),loc="center",fontsize=16)
 plt.title("Valid Time:{}".format(valDate),loc="right",fontsize=16)
 plt.suptitle("CHANTHU(19W) Typhoon- streamline and relative humidity (%) at 850 hPa",y=0.93,fontsize=20)