此範例搭配api處理縣市未來一週天氣預報資料-以新竹縣為例 F-D0047-011
Data Source: CWB opendata
已下載xml或json檔案
from cwbplot import opdata

xmlobj = opdata.read_xml("F-D0047-011.xml")
#會回傳dataframe物件,內含所有的資訊

jsonobj = opdata.read_json("F-D0047-011.json")
#會回傳dataframe物件,內含所有的資訊
若想要全自動化,直接使用api
from cwbplot import opdata
jsonobs = opdata.json_api("F-D0047-011","/home/staffid/cwbopdata/readme.api")
#會回傳dataframe物件,內含所有的資訊,dtatframe的index為天氣變數(如T,MinAT)
畫個圖
import matplotlib.pyplot as plt
import matplotlib as mpl
from cwbplot import cwb_colorbar, opdata, chtfont
import cartopy.crs as ccrs
import cartopy.io.shapereader as shapereader
from cartopy.feature import ShapelyFeature
weeksfcst = opdata.json_api("F-D0047-011","readme.api")
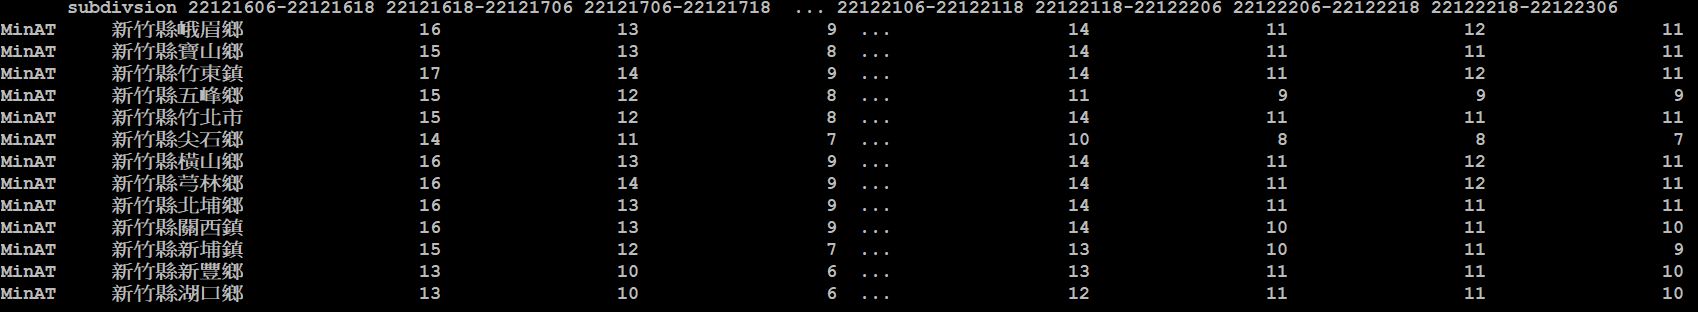
weeks_metvar = weeksfcst.loc["MinAT"]
print(weeks_metvar) #可見下圖的dataframe形式
df_hd = list(weeks_minAT)
dictweekday= {"Sunday":"星期日", "Monday":"星期一", "Tuesday":"星期二",\
"Wednesday":"星期三", "Thursday":"星期四", "Friday":"星期五",\
"Saturday":"星期六"}
color_dict =cwb_colorbar.surfT()
level = color_dict["levels"].copy()
colors = color_dict["cmap"].colors
level.pop()
subdivshp = shapereader.Reader("subdiv/TOWN_MOI_1111118.shp")
#shapefile請自行下載 https://whgis.nlsc.gov.tw/Opendata/Files.aspx
for timeidx in range(5,6): #不要從0開始,因為0是subdivsion欄位
fig = plt.figure(figsize=(16,16))
ax = plt.axes(projection=ccrs.PlateCarree())
timehd = df_hd[timeidx]
boundlon, boundlat = [], []
for countyinfo in weeks_metvar["subdivsion"]:
countyname, townname = countyinfo[:3], countyinfo[3:]
sub_metvar = int(weeks_metvar.query("subdivsion == '{}'".format(countyinfo))[timehd])
eachtown = [town for town in subdivshp.records() if town.attributes["TOWNNAME"] == townname and town.attributes["COUNTYNAME"]==countyname][0]
centerx = eachtown.geometry.centroid.x
centery = eachtown.geometry.centroid.y
bounds = eachtown.geometry.bounds
for ith, bound in enumerate(bounds):
boundlon.append(bound) if ith % 2 == 0. else boundlat.append(bound)
fc = colors[level.index(sub_metvar)]
shape_feature = ShapelyFeature([eachtown.geometry], ccrs.PlateCarree(), facecolor=fc, edgecolor='black', lw=0.8)
ax.add_feature(shape_feature)
if townname == "竹東鎮":
ax.text(centerx+0.015,centery,townname +"\n " +str(sub_metvar) + "$^\circ$C", ha="center",va="center",font=chtfont.taipei_nomo)
else:
ax.text(centerx,centery,townname +"\n " +str(sub_metvar) + "$^\circ$C", ha="center",va="center",font=fpath)
sttime = timehd.split("-")[0]
endtime = timehd.split("-")[-1]
if endtime[-2:] == "18":
weekday = datetime.strptime(endtime,"%y%m%d%H").strftime("%A")
figtitle = countyname+" "+ timehd + " " + dictweekday[weekday] + " " + "白天最低體感溫度預報"
else:
weekday = datetime.strptime(sttime,"%y%m%d%H").strftime("%A")
figtitle = countyname+" "+ timehd + " " + dictweekday[weekday] + " " + "晚上最低體感溫度預報"
ax.set_title(figtitle,font=chtfont.taipei_bold, fontsize = 20)
changcmap = mpl.colors.ListedColormap(color_dict["cmap"].colors[:23])
norm = mpl.colors.BoundaryNorm([pos+0.5 for pos in range(-1,22)], changcmap.N)
cbar = fig.colorbar(mpl.cm.ScalarMappable(norm=norm, cmap=changcmap), ax=ax,pad=0.03)
cbar.set_ticks( range(22), labels=range(-1,21))
cbar.ax.tick_params(length=0)
ax.set_extent([min(boundlon),max(boundlon),min(boundlat),max(boundlat)], ccrs.PlateCarree())
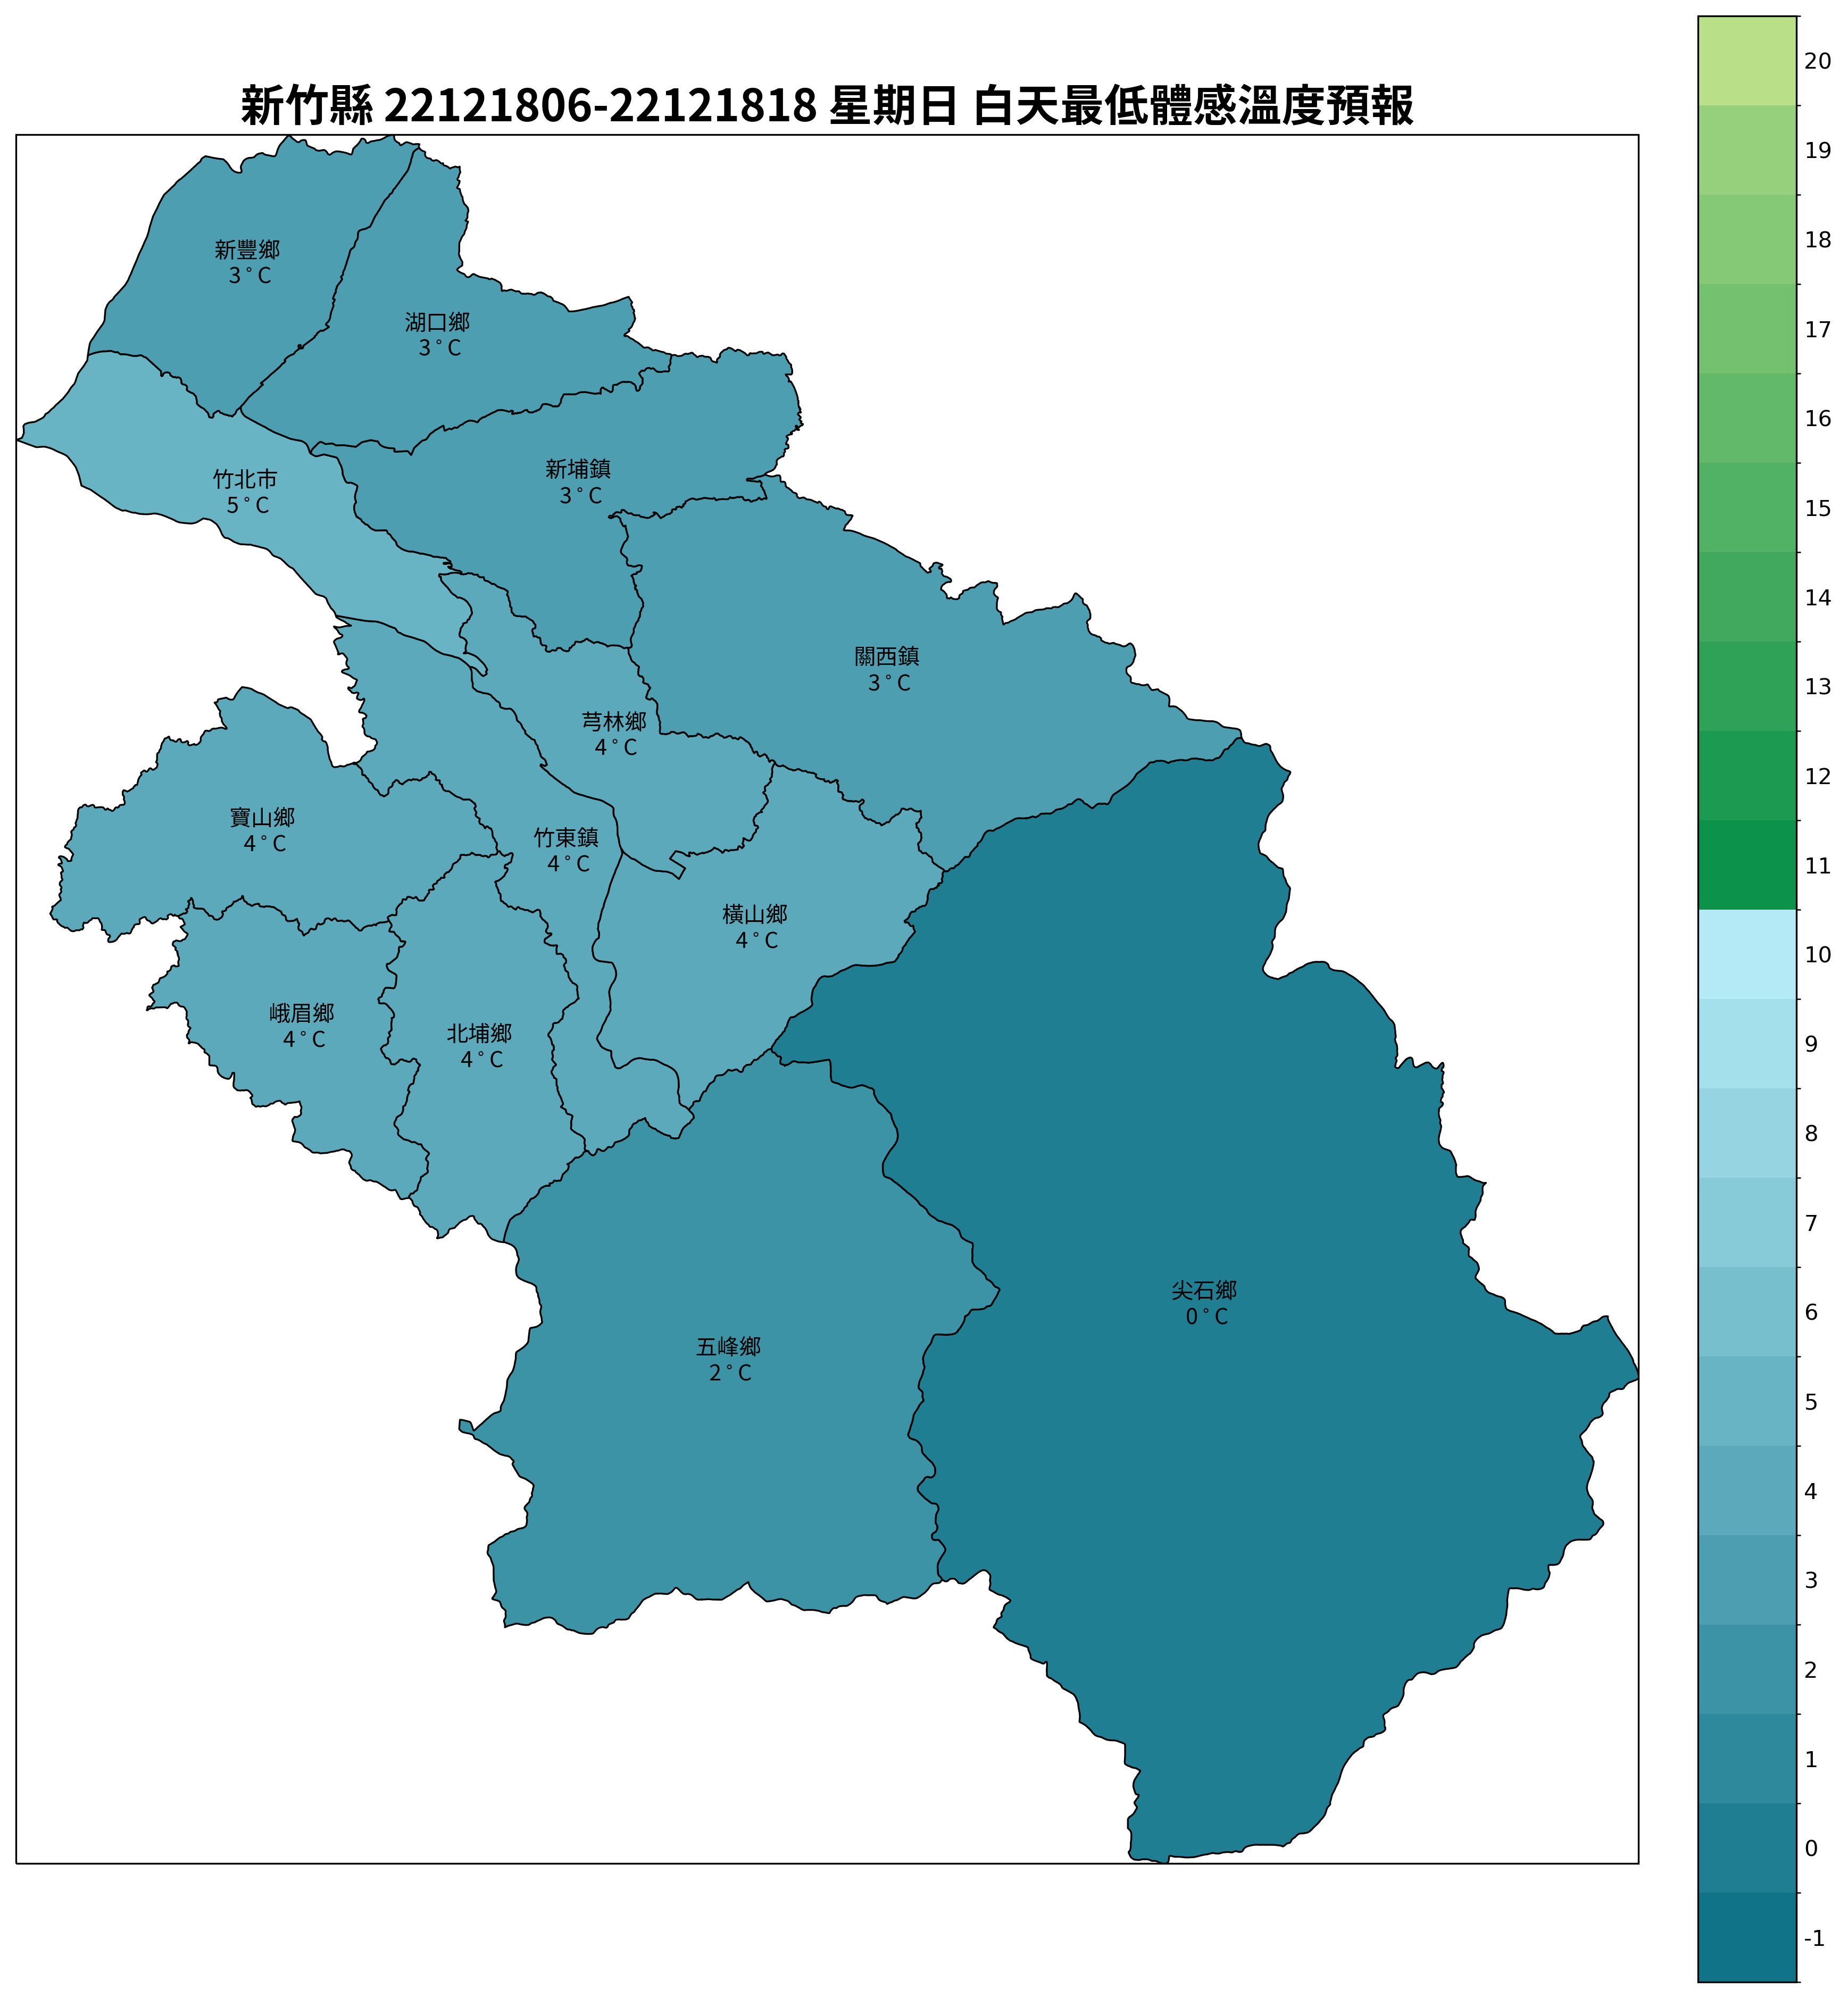
圖如下