logo
  • Getting started
  • Central Weather Bureau Open Data
  • IO USEFULTOOL
  • Gallery
  • Some tips
  • API reference
  • Rainfall
  • Surface Temperature and sea level pressure
  • Rainfall
  • 此範例處理降雨估計資料-QPESUMS過去1小時定量降雨估計格點資料 O-B0045-001
  • 此範例處理數值預報模式-區域預報模式(WRF-3公里) M-A0064-???
  • Hist2d for frqency scatter plot
  • Performance digram
On this page
  • Basemap
  • Cartopy
  • Projinfo
  • Data Analysis

Gallery

Basemap

The projection setting of this graph is done by basemap, but strongely change to use cartopy.

  • _images/12acc_rainfall_basemap.png

    Rainfall

  • _images/surftemp_basemap.png

    Surface Temperature and Sea Level Pressure

  • _images/two_colorbar.png

    Two colobar in a Figure

  • _images/rh_streamline_basemap.png

    Relative humidity and streamline
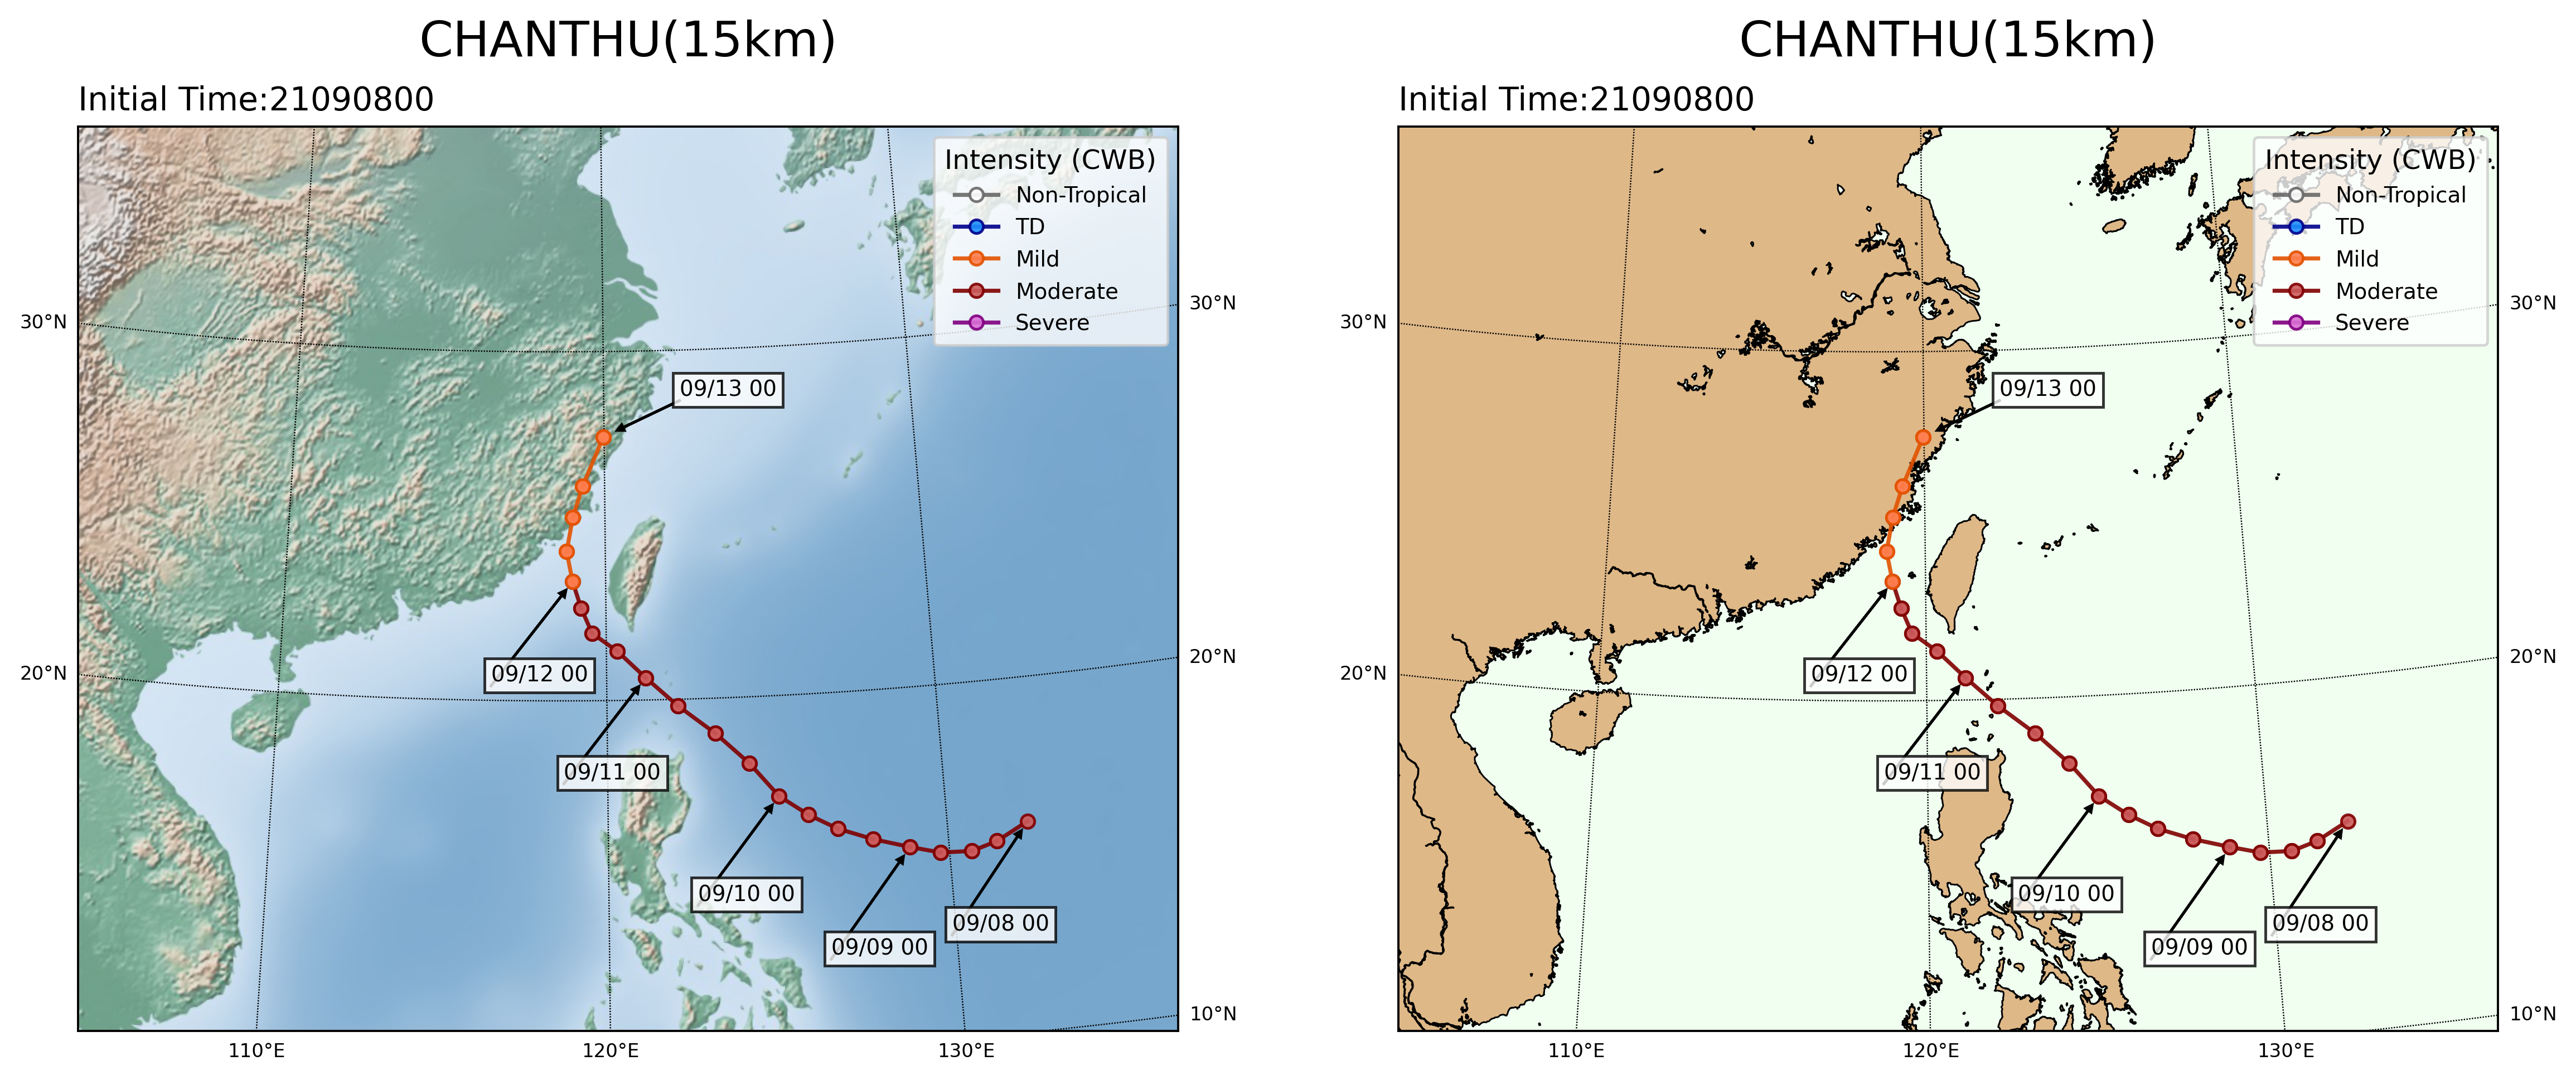
  • _images/CHANSHU.png

    Typhoon Track

  • _images/Vertical_cross_section.png

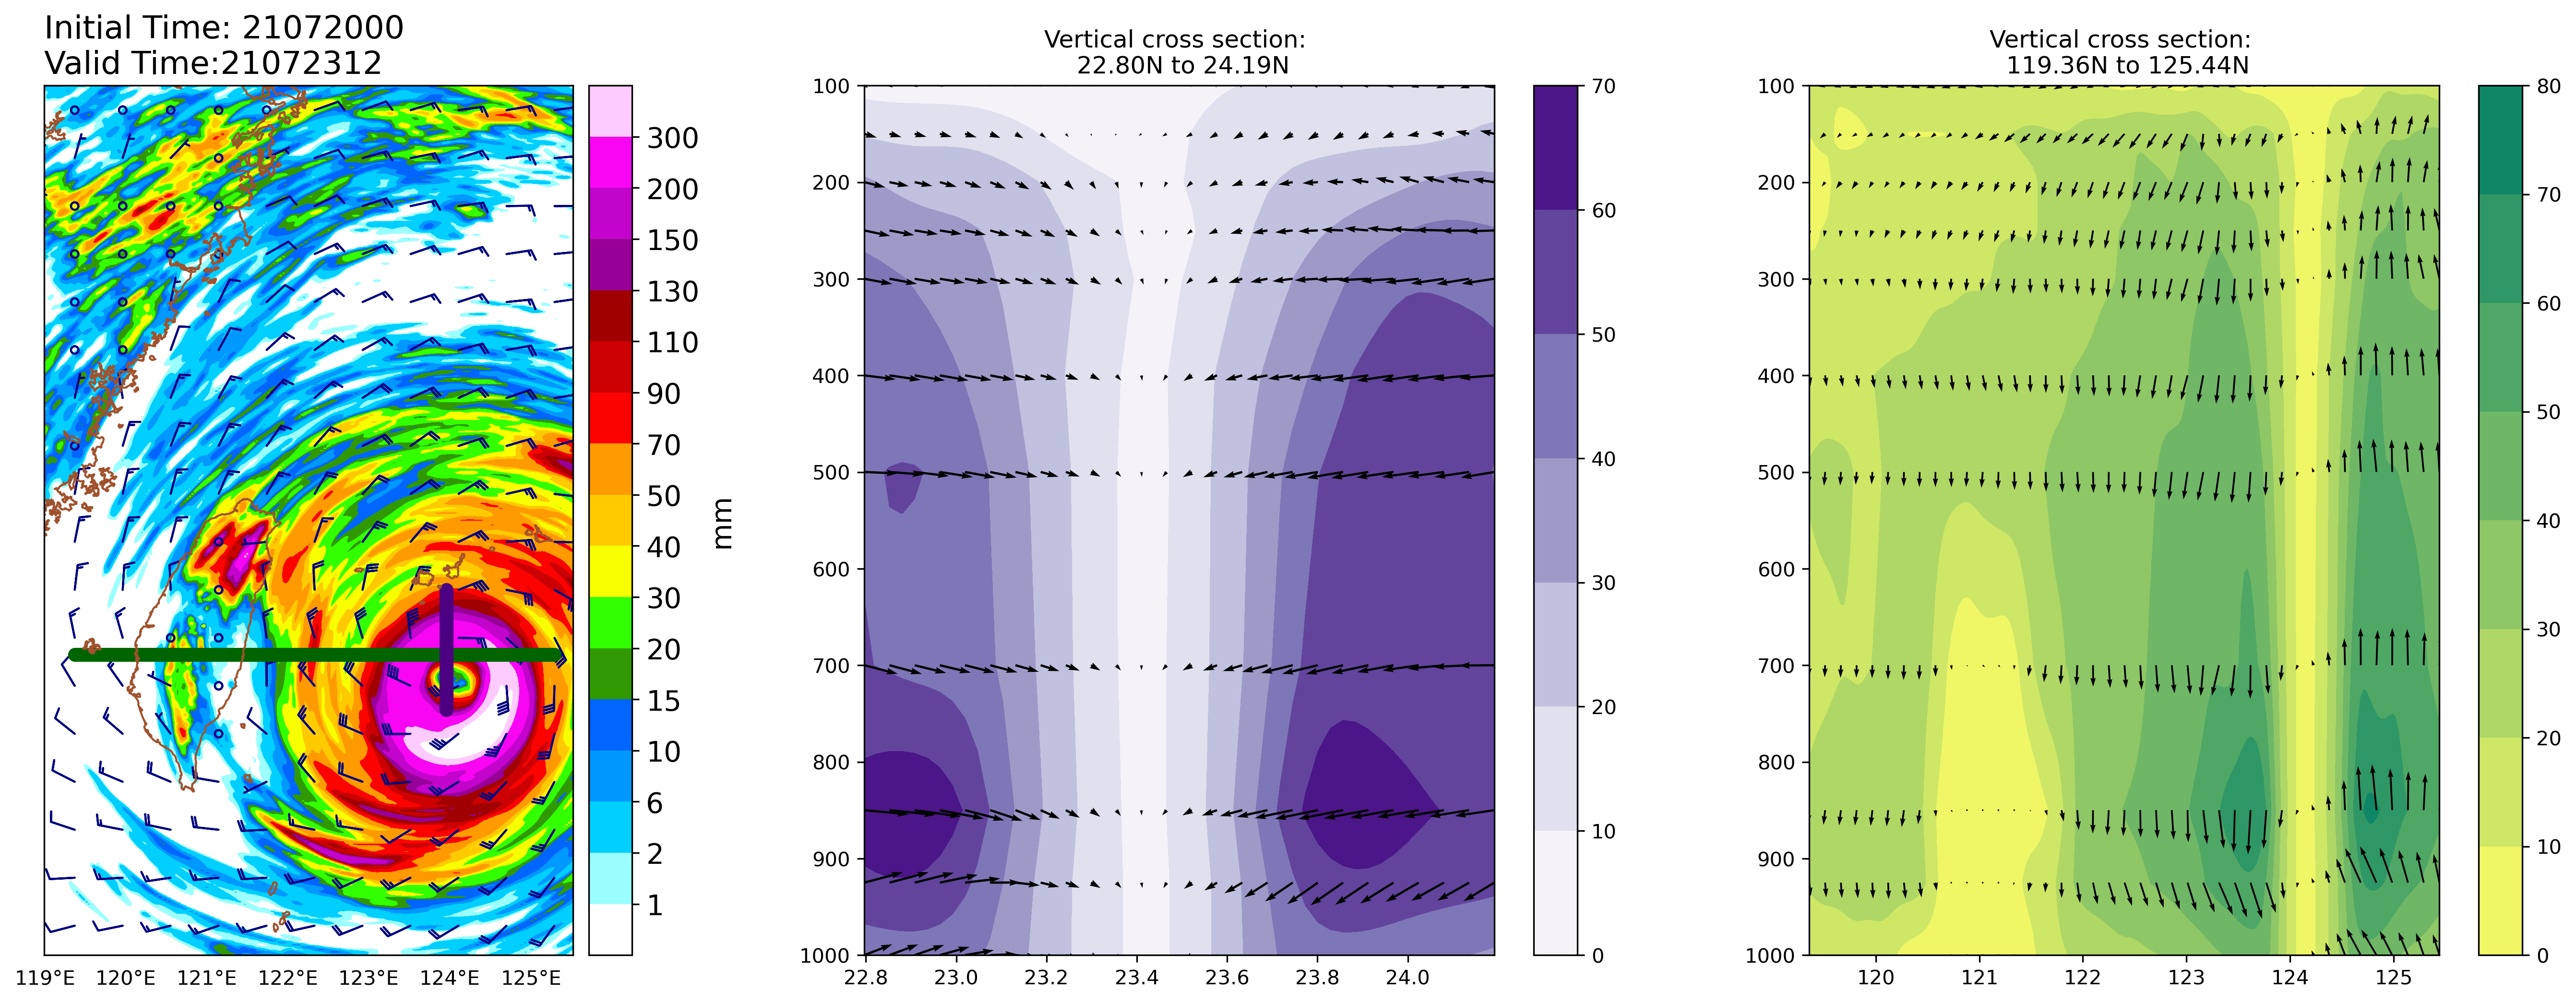
    Vertival cross section for grib2 data format

Cartopy

The projection setting of this graph is done by cartopy.
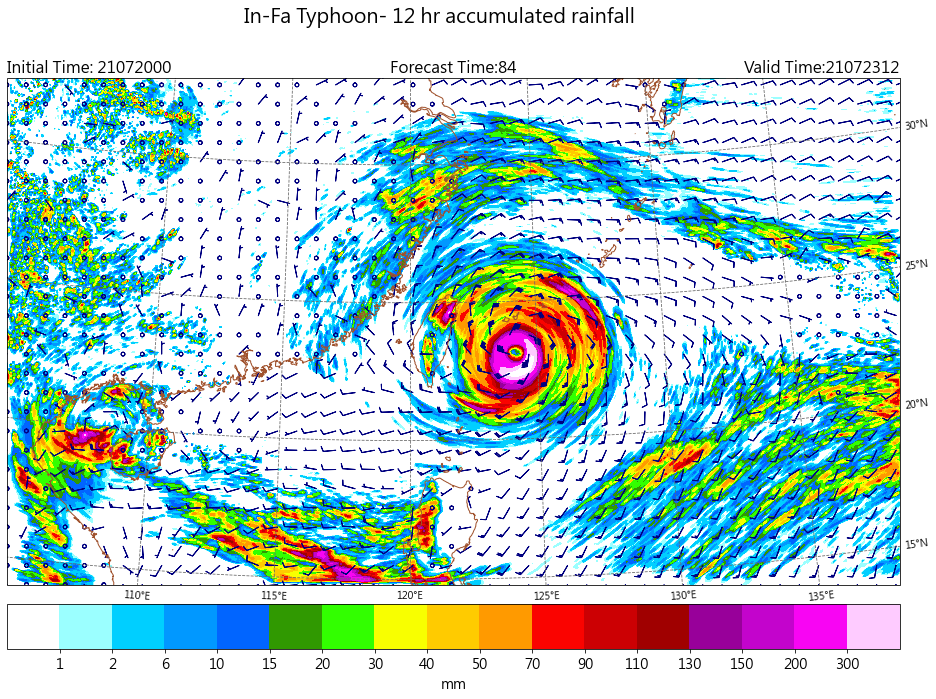
  • _images/12acc_rainfall_cartopy.png

    Rainfall

  • _images/surftemp_basemap.png

    Surface Temperature and Sea Level Pressure

Projinfo

This section provieds some graphs for how to ues projinfo

important: projinfo is based on Basemap
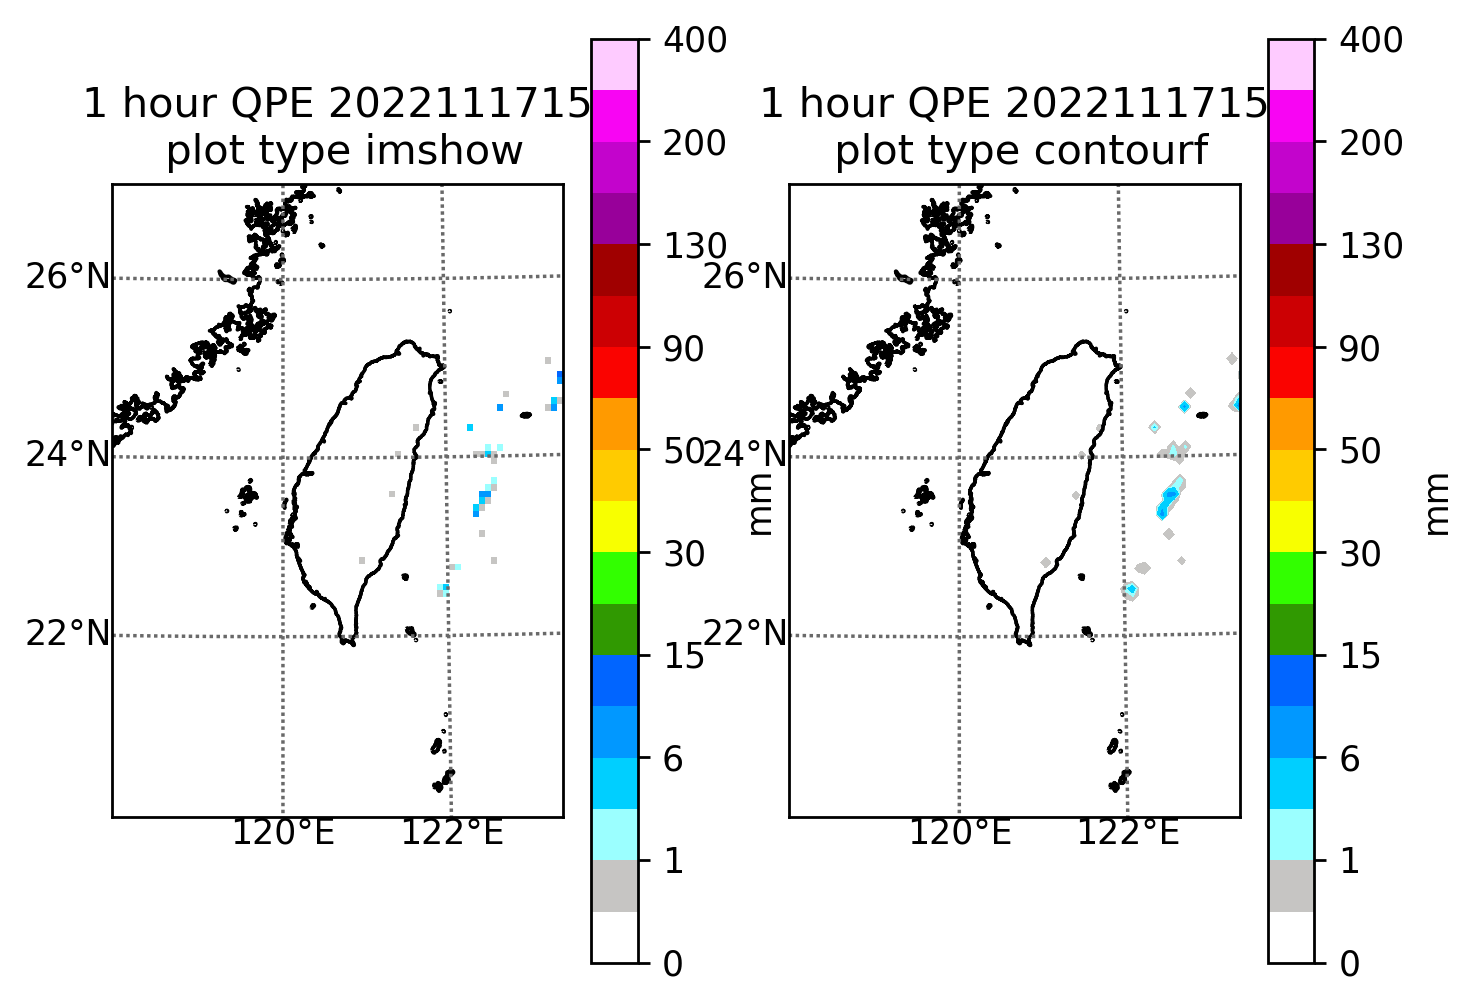
  • _images/O-B0045-001.png

    1 hour QPE

  • _images/M-A0064.png

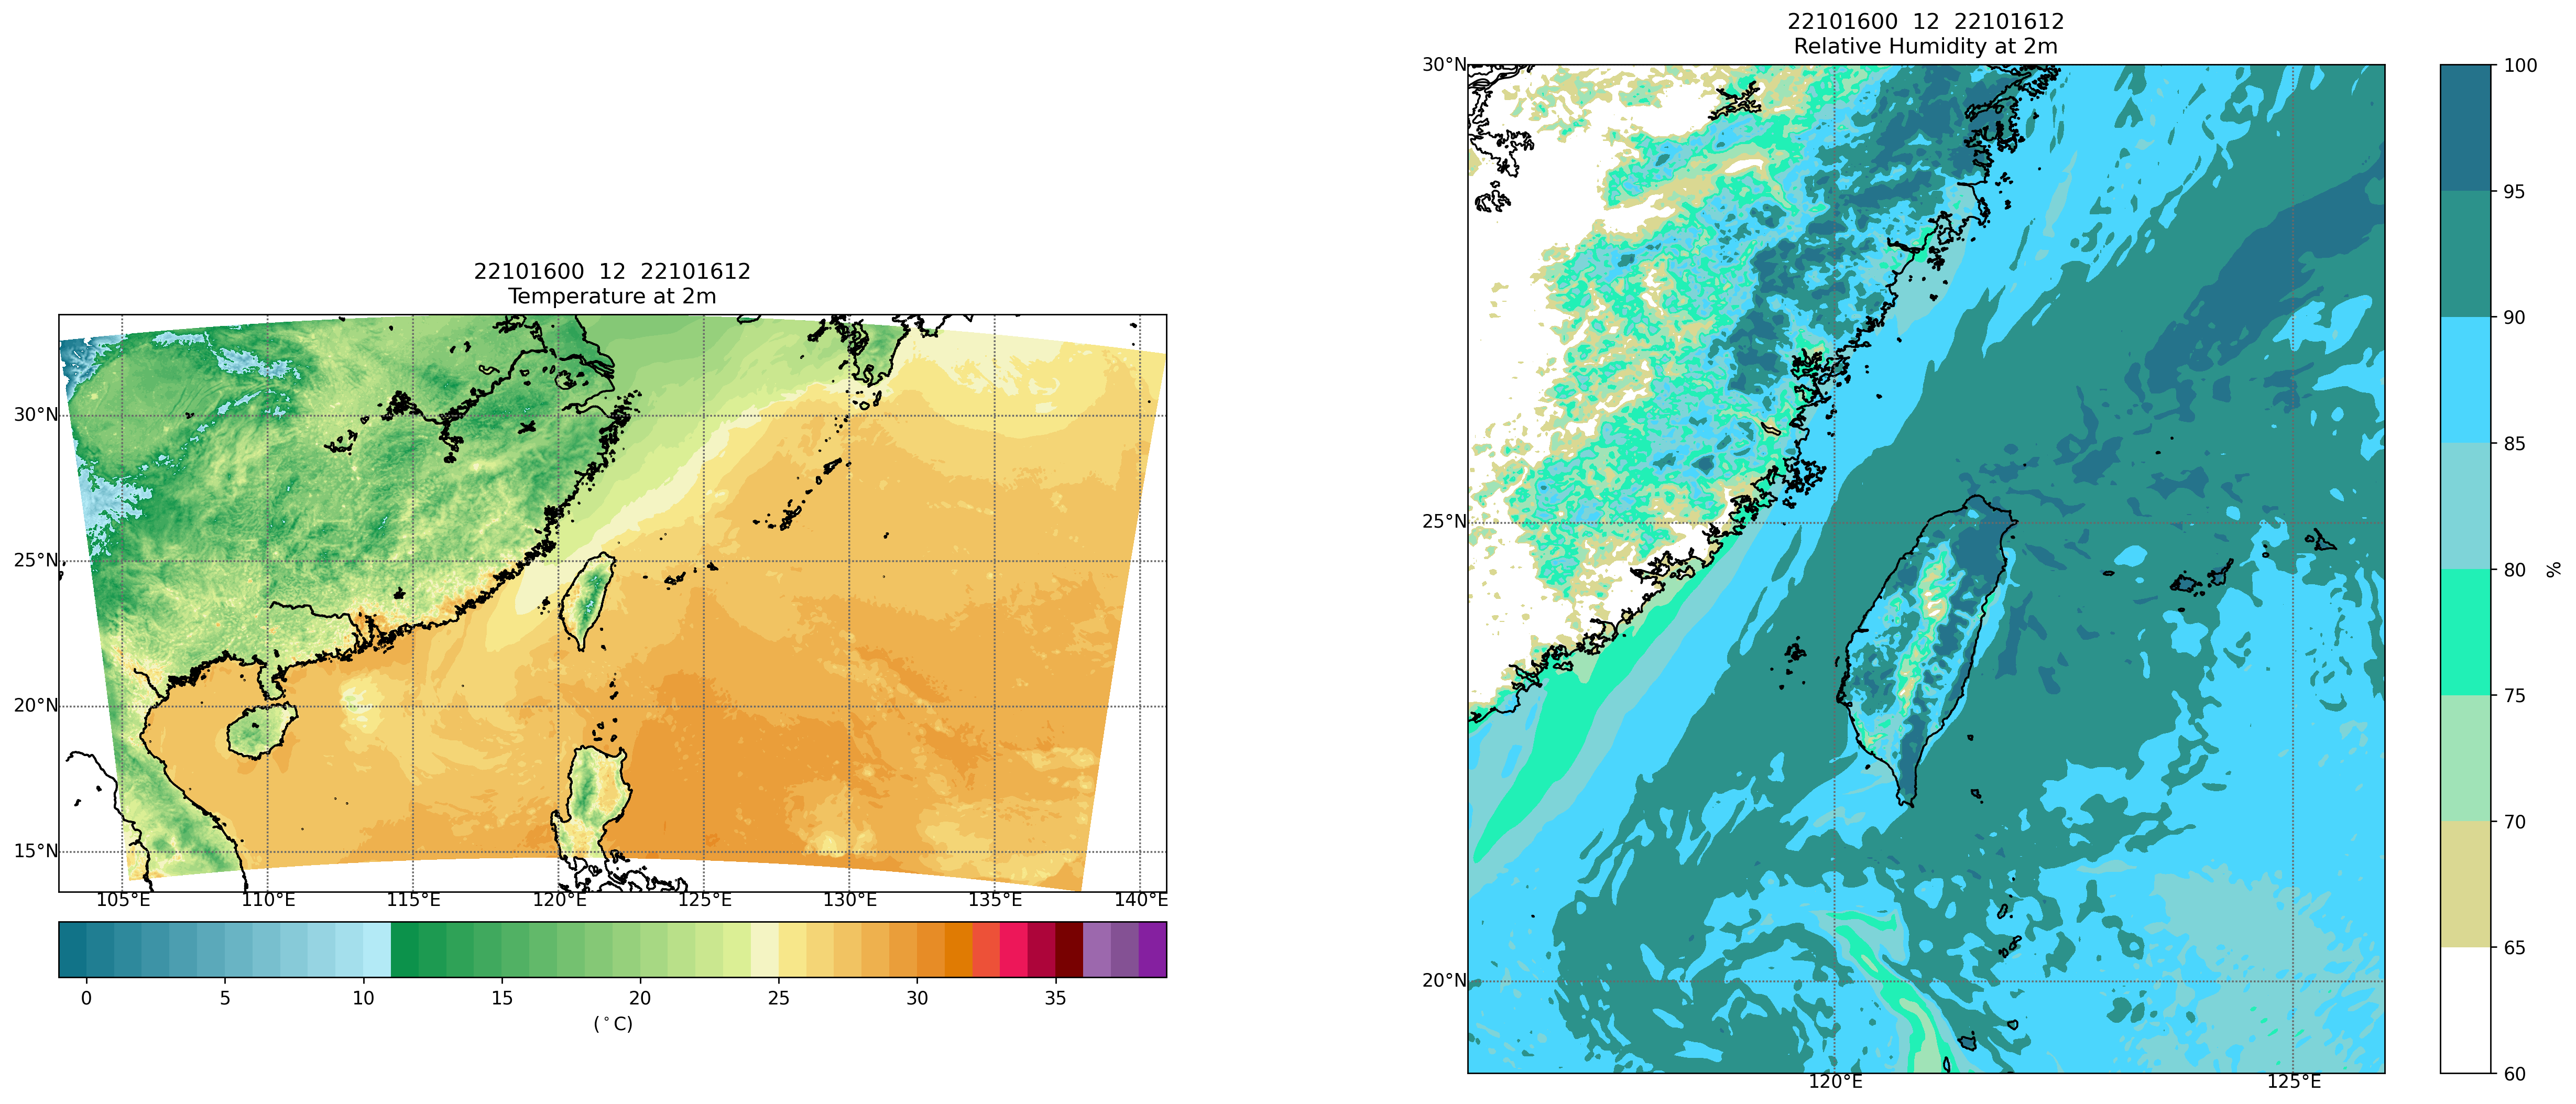
    Surface Temperature and surface relative humidity

Data Analysis

This section provieds some graphs for data analysis.

  • _images/Freq_example.png

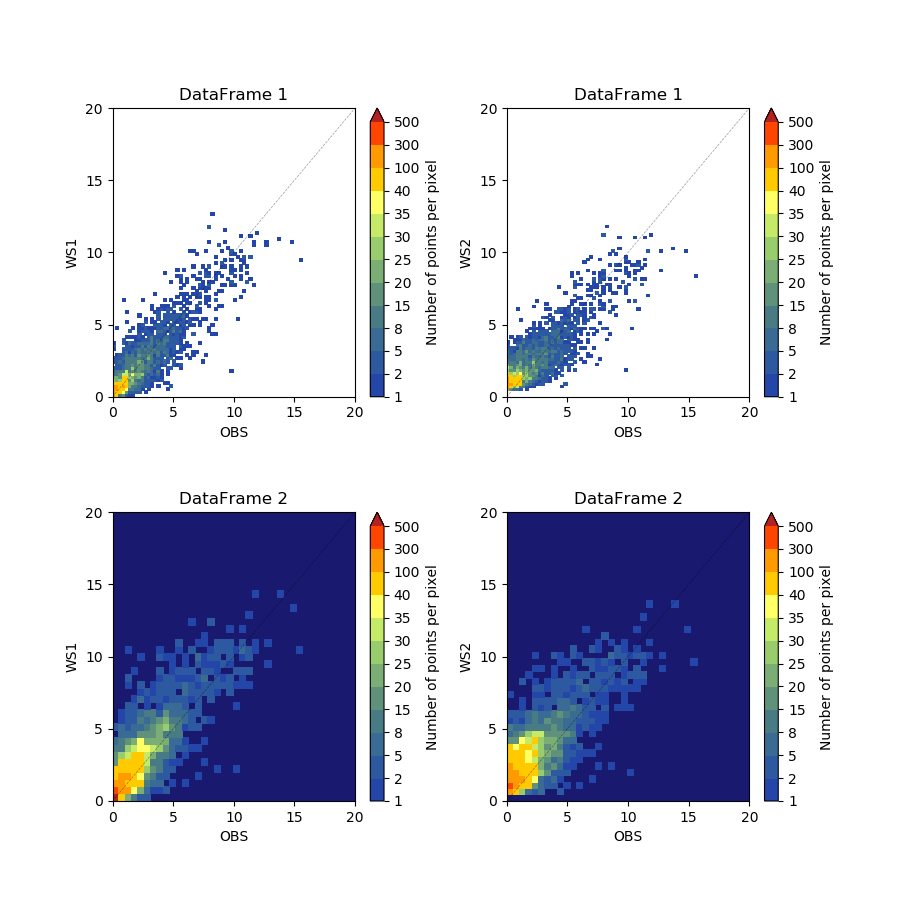
    Frequency scatter plot by hist2d
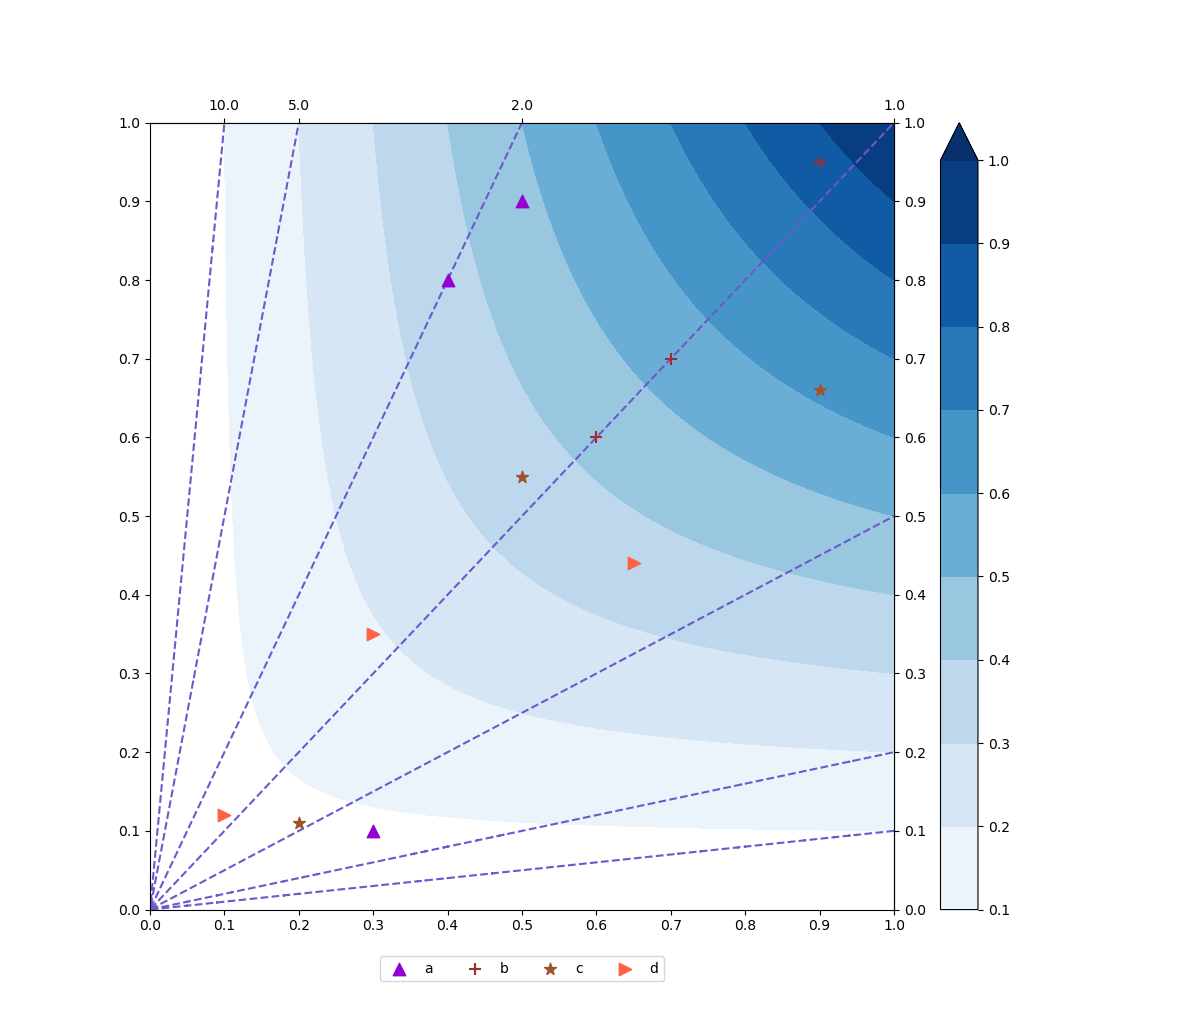
  • _images/perform_dig.png

    Performance digram

  • _images/T2_rmse_nearestgrid.png

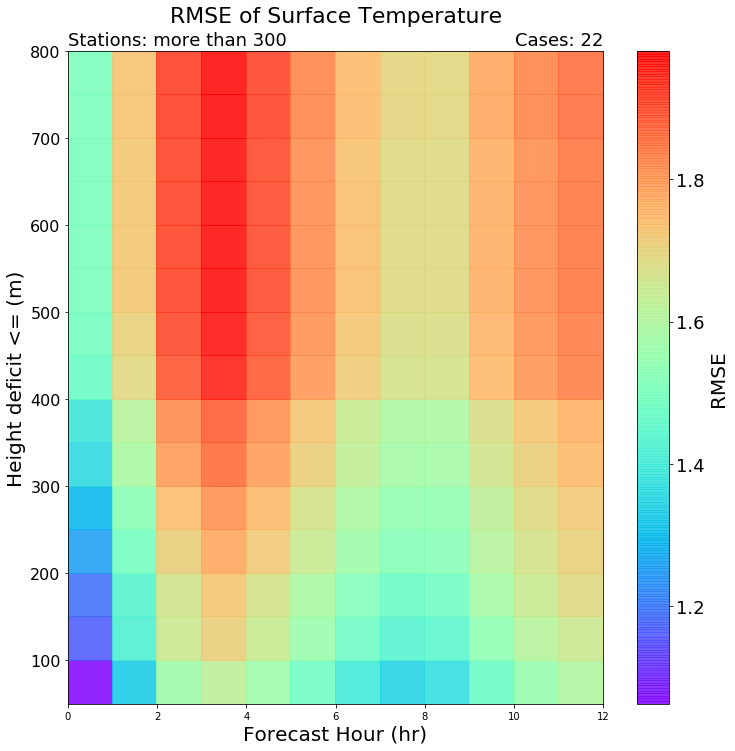
    Surface temperature dia with different elevation deficit

previous

IO USEFULTOOL

next

Rainfall

© Copyright 2021, CCLiu.

Created using Sphinx 4.3.2.